Size Limit Builder
The Size Limit Builder delivers fast and practical fisheries science to groups that are looking to design size limits for their fishery. It lets users compare different size limits for a species of interest to evaluate tradeoffs between sustainability and catch associated with the different size limits.
Learn to use the Size Limit Builder’s functions and interpret the results.
At a minimum, you need:
- A geographically-appropriate life history for the species of interest
Additional optional data include:
- Length data for your species of interest. This length data is “fishery-dependent,” meaning it is collected from samples of fishery catch
- A selectivity function for the fishery and selected life history
- Geographically appropriate life histories and accompanying optional data for additional species
- FishKit for evaluating tactical management options to learn when the Size Limit Builder can be used in practice
- FishKit for adjusting existing management measures to learn when the Size Limit Builder can be used in practice
- Size Limit Builder: concepts and considerations
- More information on Life histories
- More information on Fishery-dependent length data
Steps for use
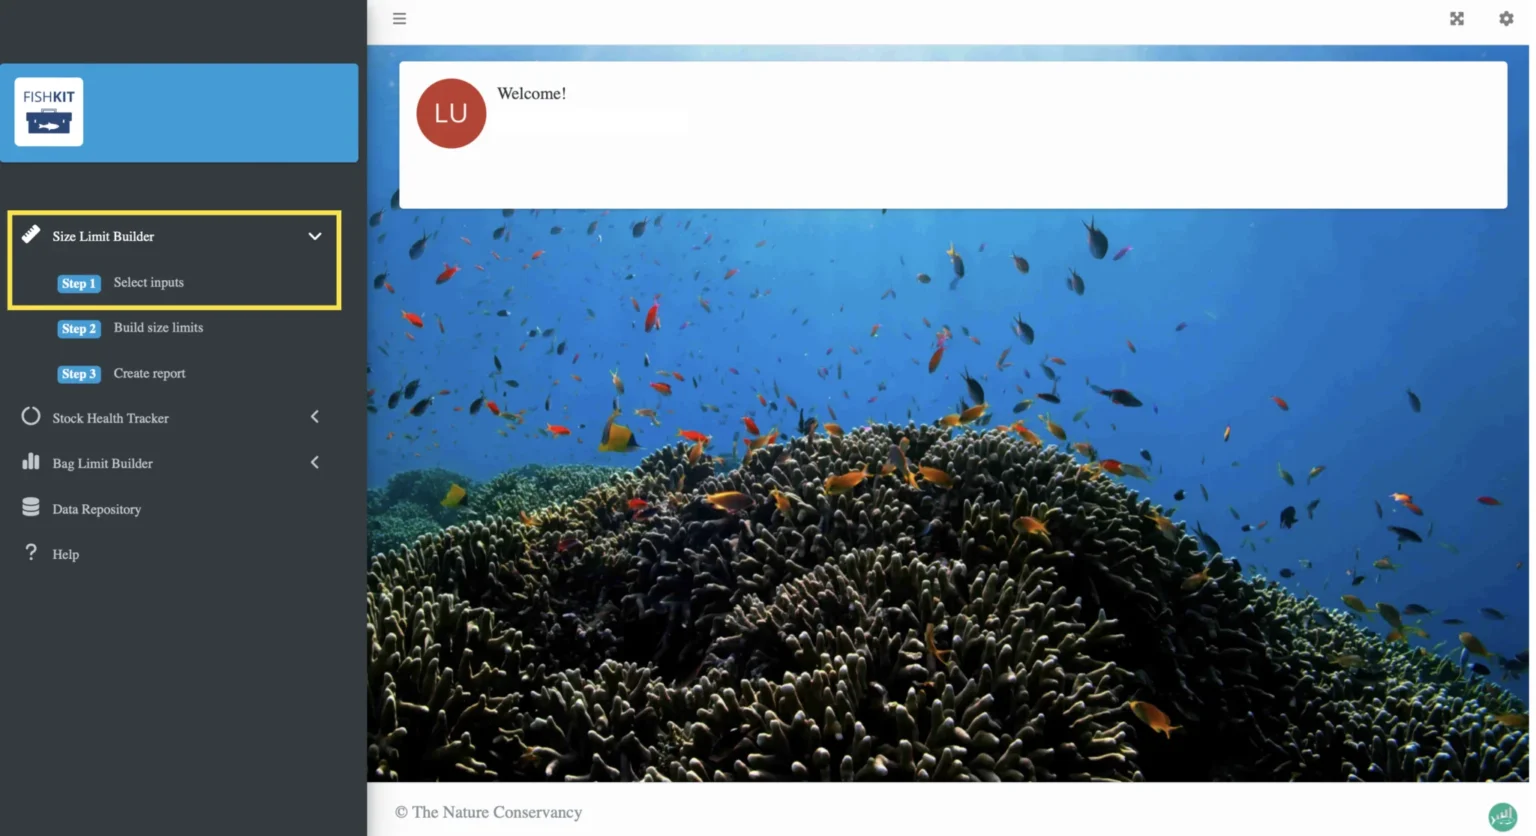
This section walks through the steps for creating size limit options with the Size Limit Builder. The steps in this section correspond with the steps in the left hand menu of the FishKit app.
1. Select inputs
- Create a new life history with information you have gathered on a species of interest
- More information on Life histories
1.b. Select life histories
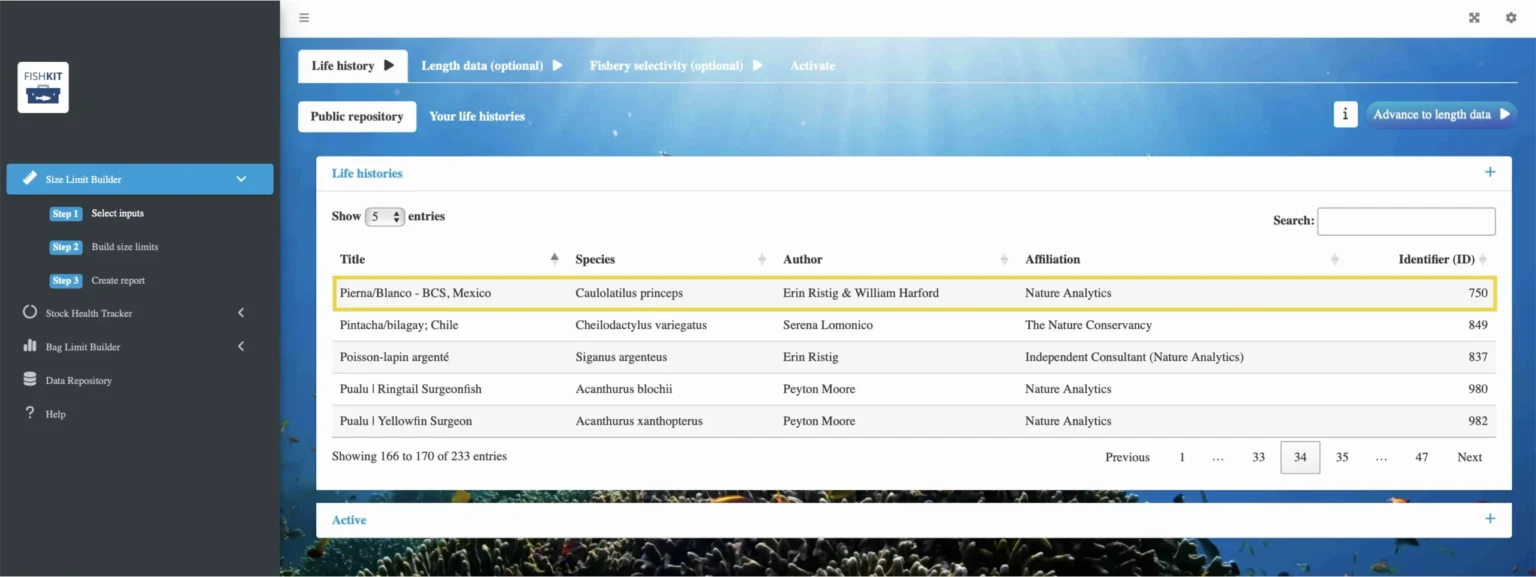
Click “Advance to life history.” Here you can access all the life histories available in the public repository. You can browse the life histories by clicking through the pages using the numbers at the bottom of the public repository. Alternatively, if you are looking for a specific species, you can type the name in the search bar.
If you want to use a life history you have previously uploaded to the Data Repository, click on “Your life histories” along the top of your screen.
Once you find the life history you’d like to use, either in the public repository or in your personal life histories, click on it.
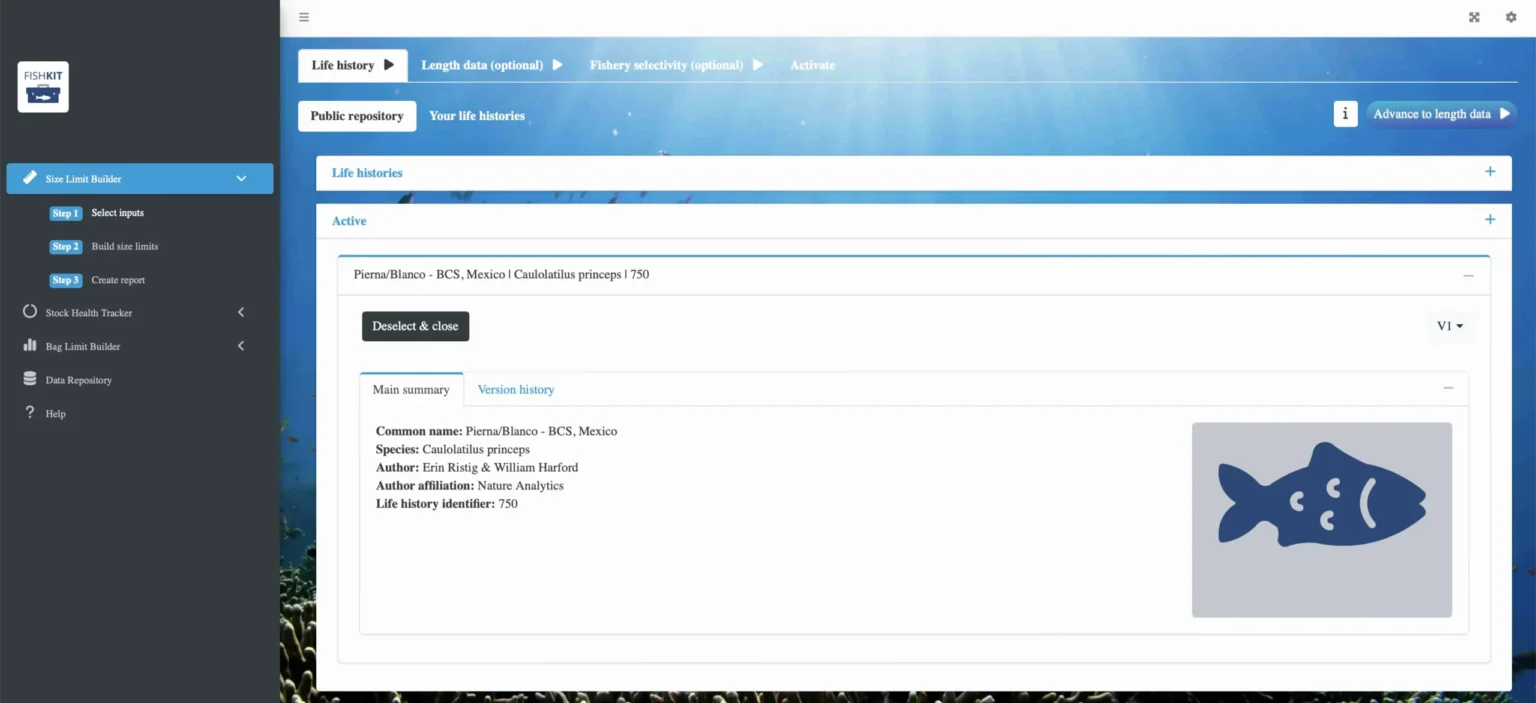
The “Active” tab will open with more information about the life history, including a “Main summary” tab with descriptive information, and a “Version history” tab with the parameters themselves.
If you would like to remove a life history once you have selected it, click on the “Deselect & close” button under the life history’s heading. Go back to the list of public life histories to select a new life history.
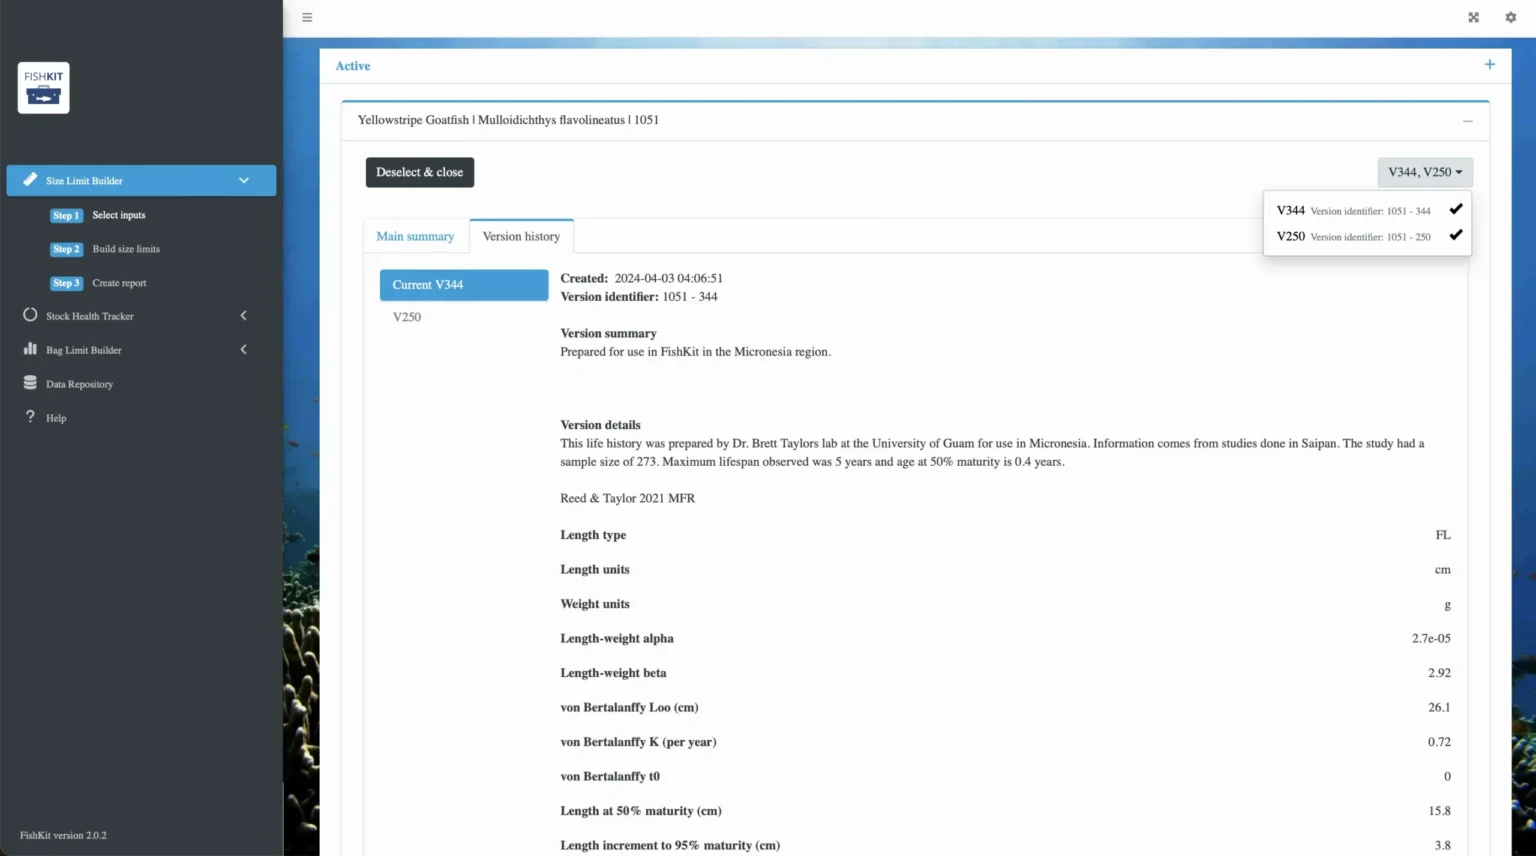
In the upper right, if there are multiple versions of the life history, you can select your desired version(s) from the dropdown menu. Selected versions will show a checkmark next to them, and they will be listed in the upper right corner.
If your selected life history has multiple versions, you can explore the differences between the life history parameters by navigating to the “Version history” tab. On the left, you can select between the current version (which is the most recent version), and other versions (previous versions). Selecting a version in the “Version history” section does not change which version(s) you have selected, it just shows you the parameters for the associated version. The most recent version is always auto-selected.
If you would like to utilize more life histories, you can go back to the “Life histories” tab above the “Active” tab and repeat the same process to find and select a life history.
Once you have decided you would like to use the selected life history/histories for analysis, click “Advance to length data” in the upper right corner.
- Create a new life history with information you have gathered on a species of interest
- More information on Life histories
1.c. Select length data (optional)
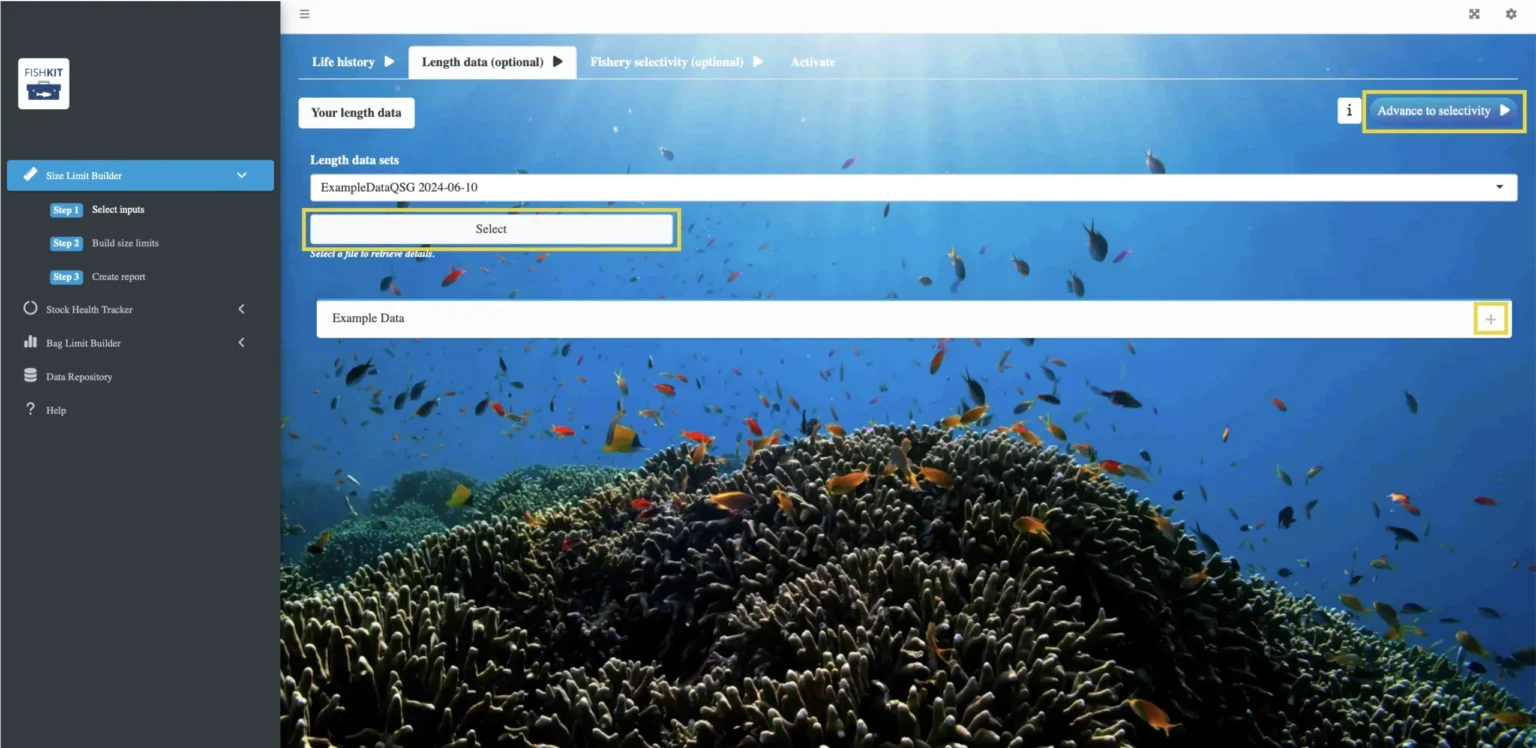
The length data step is not required to use the Size Limit Builder. However, if you have length data you would like to use, you can select it here. If you do not have length data, click the “Advance to selectivity” button in the upper right corner.
Length data sets you have previously uploaded to the Data Repository will appear in the dropdown menu under “Length data sets.” Click on the dropdown menu to preview your data sets, click on the one you would like to activate, and then click the “Select” button below the dropdown menu.
You can then click the “+” next to the name of your data set to see more information about the data set, including a “Summary” tab with descriptive information, and a “Data set” tab with a preview of the data.
If you would like to utilize multiple length data sets, you can continue to click on them in the dropdown menu and select them. Once you have selected all the desired length data sets, click the “Advance to selectivity” button in the upper right corner.
- Uploading length data to the Data Repository
- More information on Fishery-dependent length data
1.d. Select a fishery selectivity function (optional)
A fishery selectivity function is not required to use the Size Limit Builder. However, if you have previously created a selectivity function in the Data Repository for your fishery, you can select it here. If you don’t have a selectivity function, click the “Advance to activate” button in the upper right corner.
Selectivity functions you have previously uploaded to the Data Repository will appear in the dropdown menu under “Selectivity functions.” Click on the dropdown menu to preview your functions, click on the one you would like to select, and then click the “Select” button below the dropdown menu.
This will list your function below the dropdown menu. You can then click the “+” button next to the function to see more information about it, including a “Summary” tab with descriptive information, and a “Chart and data set” tab with the actual function.
If you would like to remove a selectivity function once you have selected it, click on the “Deselect & close” button under the name of the function. Go back to the dropdown menu of your selectivity functions to select a new one.
You can utilize multiple selectivity functions by repeating the same process in the dropdown menu.
Once you have selected a selectivity function(s), click the “Advance to activate” button in the upper right corner.
- Uploading selectivity functions to the Data Repository
- More information on Fishery-dependent length data
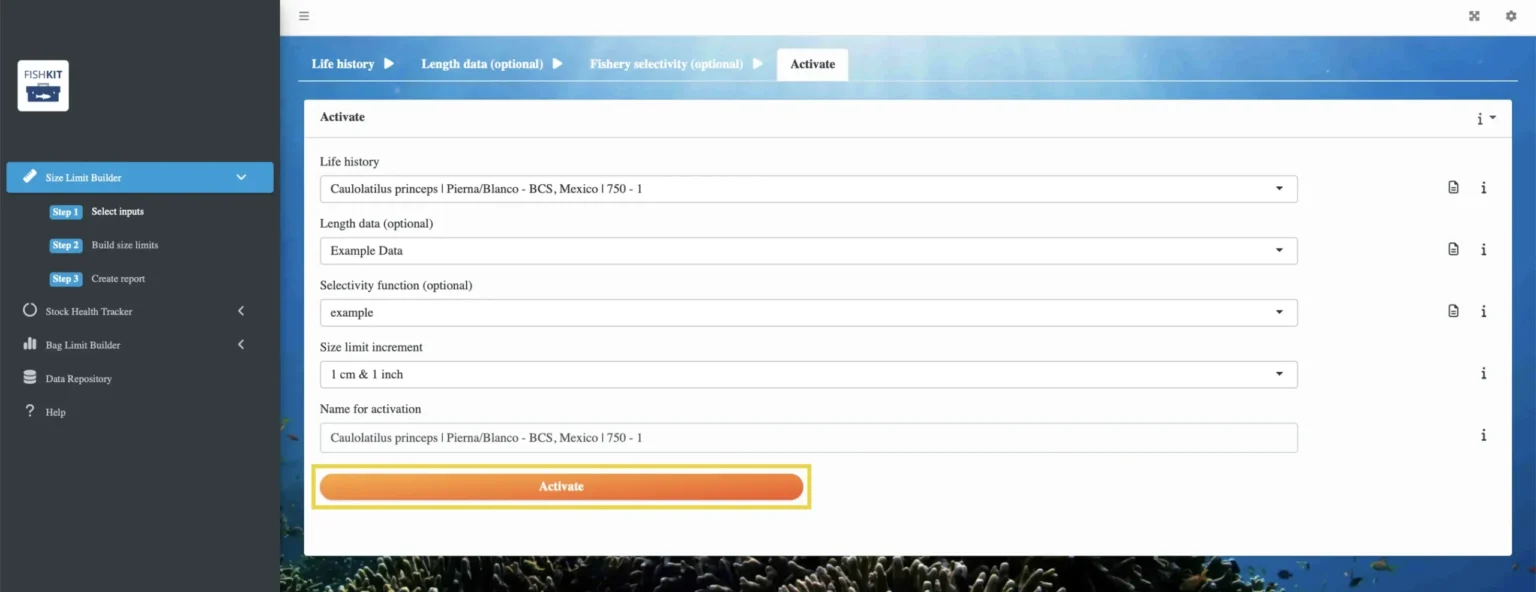
1.e. Activate your inputs
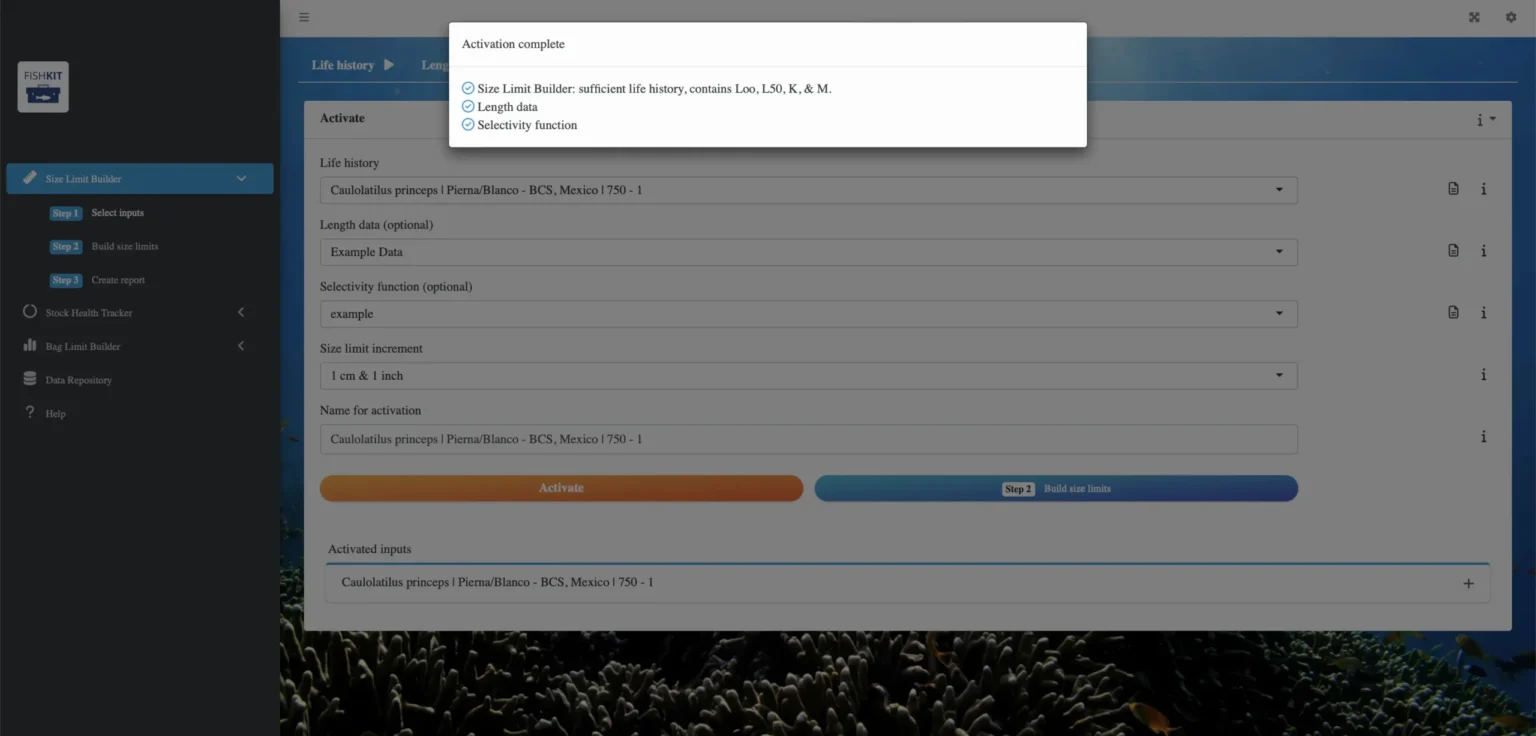
After the activation processes, you will get an alert saying “Activation complete.” Blue check marks indicate there is sufficient data to be used in the Size Limit Builder. Click anywhere on the screen to dismiss the alert.
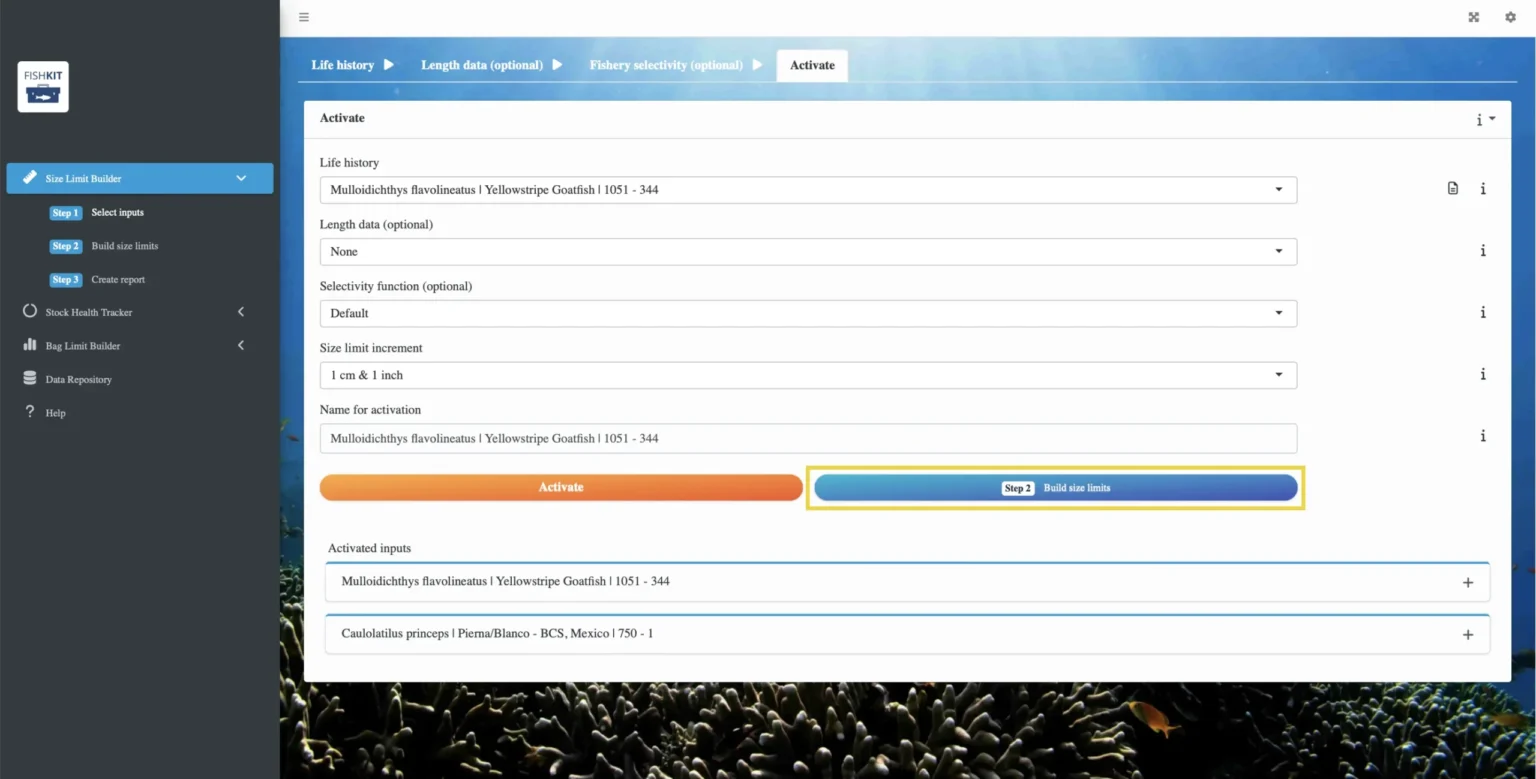
If you would like to activate different combinations of life history, length, and selectivity function data, you can follow the same process of selecting them from the respective dropdown menus, naming your activation, and clicking “Activate.”
Relevant Modules:
2. Build size limits
2.b. Explore the Size Limit Builder dashboard
You have now entered the Size Limit Builder dashboard. The name you gave your activation on the previous page – or, if you did not customize a name, the name of the life history – will be listed along the top of the page.
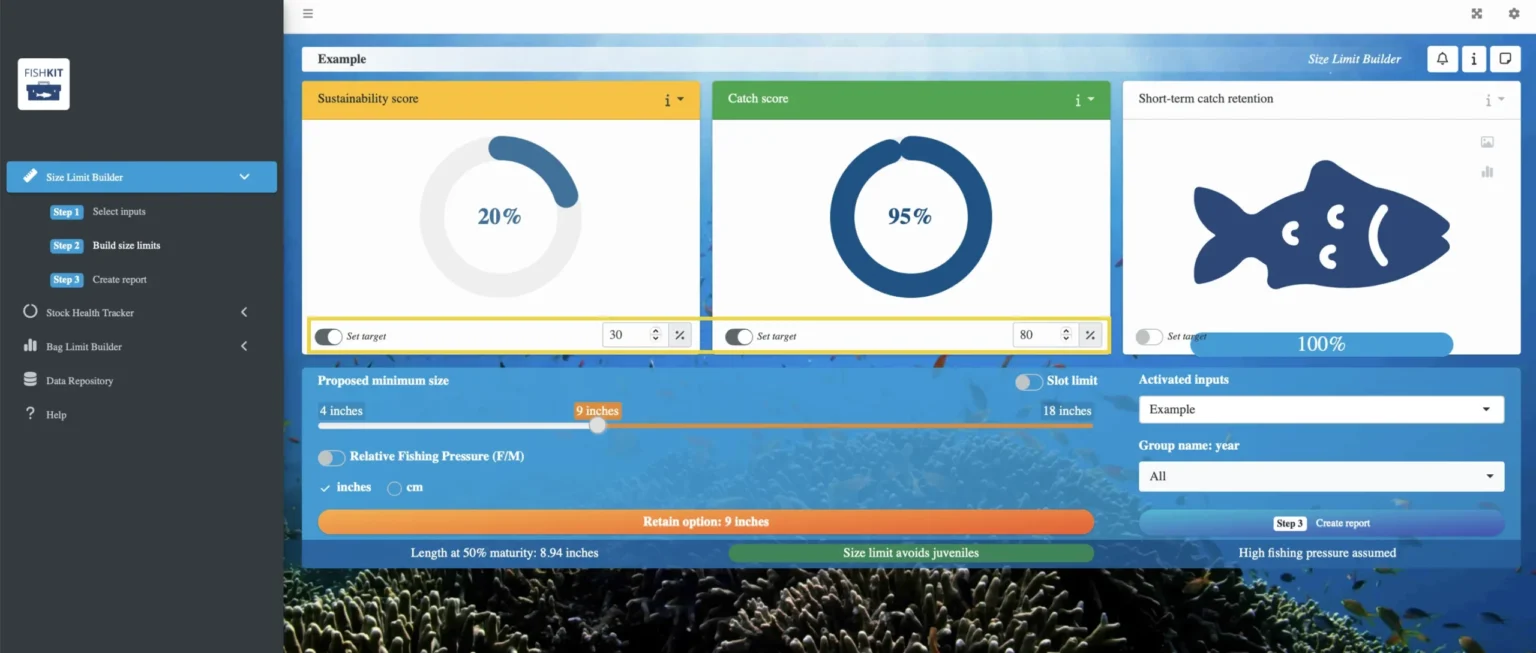
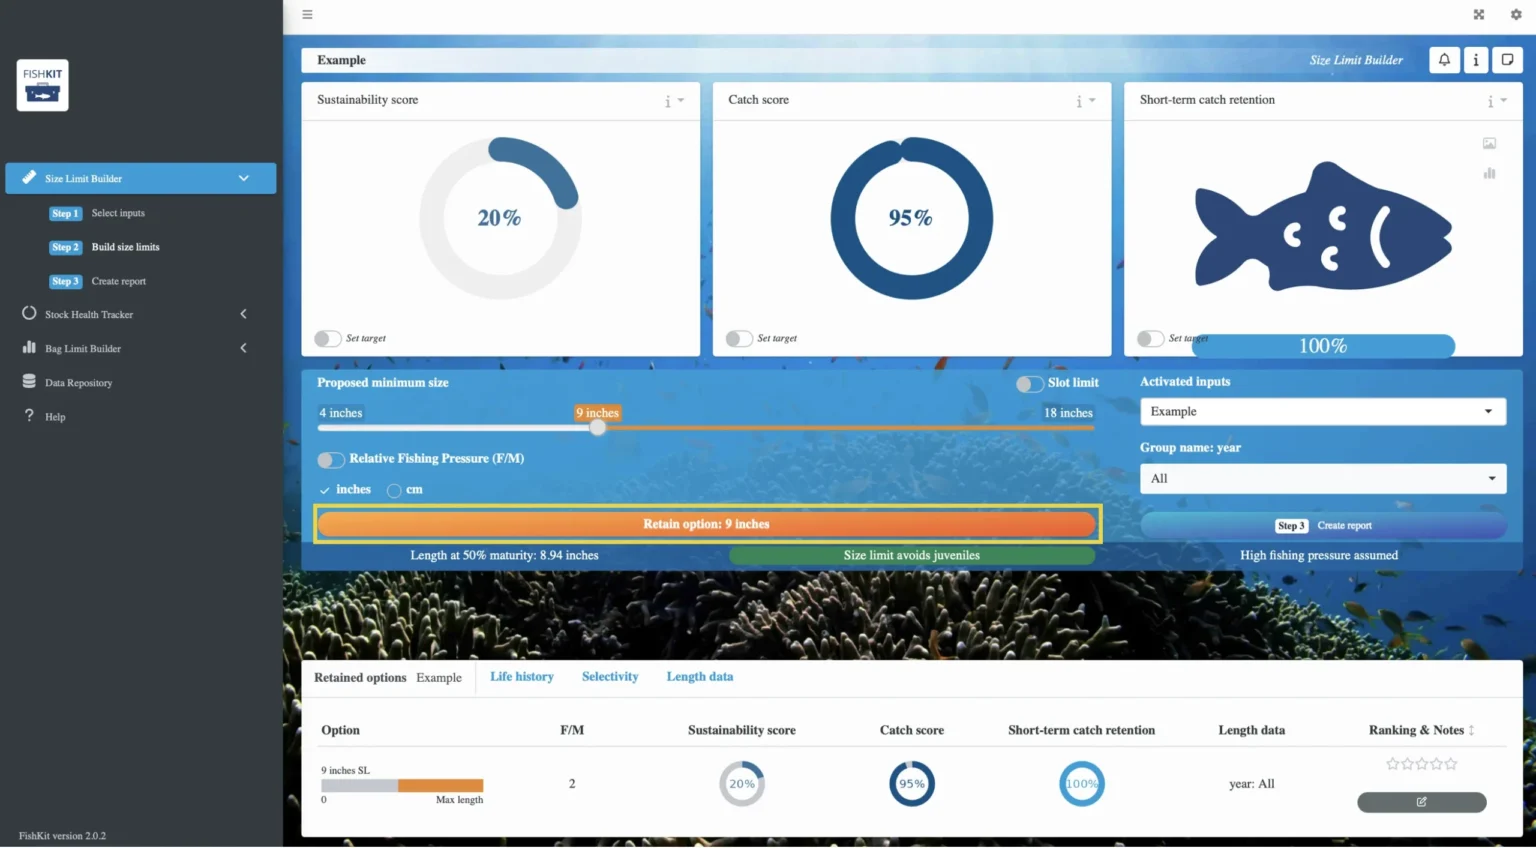
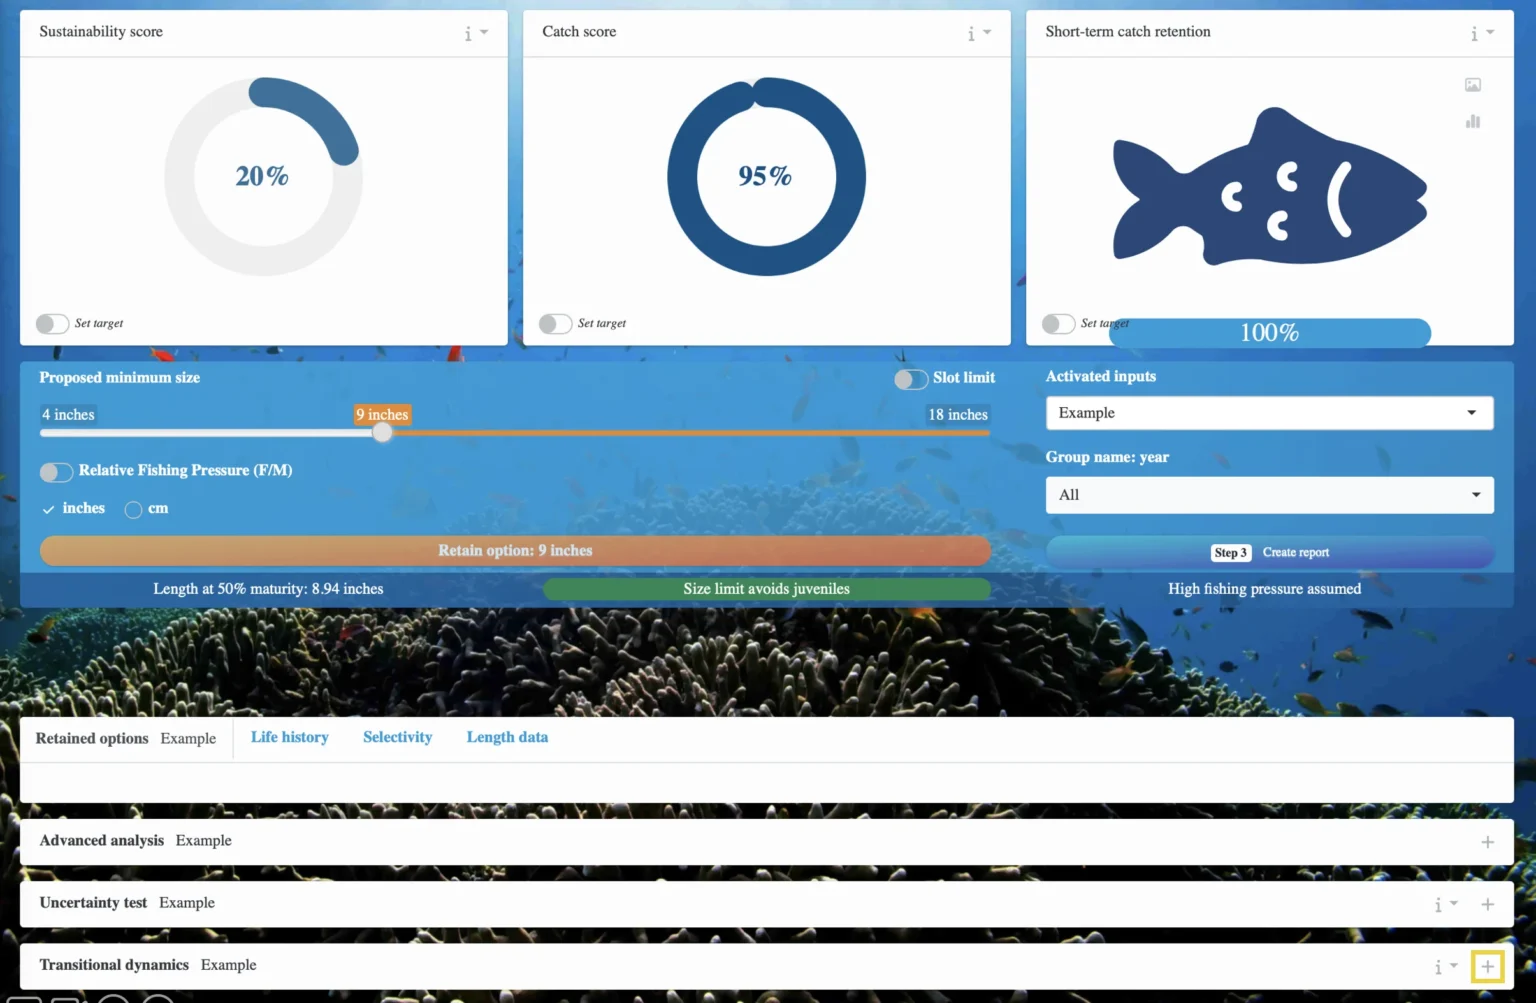
The orange slider and button indicate the minimum size limit that was automatically selected, which is set just above the length at 50% maturity. Above are two dials representing the “Sustainability score” and “Catch score” associated with this size limit.
If you activated length data, you will see a third dial, “Short-term catch retention,” to the right of the catch score dial. This score is the percentage of the catch in weight that will be caught immediately after establishing a size limit. It illustrates how the composition of catch could change upon the implementation of a size limit.
The sustainability score, also known as spawning potential ratio (SPR), is akin to sustainable fishing, which reflects the objective of maintaining enough adult fish in the water to ensure replenishment so that fishing can continue indefinitely. The sustainability score has a range from 0% (no fish left) to 100% (unfished). Very low potential for replenishment can jeopardize production of offspring. Optimal values for this metric vary for different species, but under sustainable harvest, values ranging from 30%-40% are generally a good target reference point, assuming 100% compliance with the associated size limit.
The catch score, also known as yield per recruit (YPR), is a proxy for achievement of yield and has a range of 0% (no fishing) to 100% (maximum YPR), with higher scores indicating higher yield in total weight. A value of 100% represents the theoretical maximum yield for the population, while a score above 80% could be considered a pretty good yield.
- Interpreting results from the Size Limit Builder
- Sustainability score and catch score
2.c. Adjust Size Limit Builder dashboard inputs (optional)
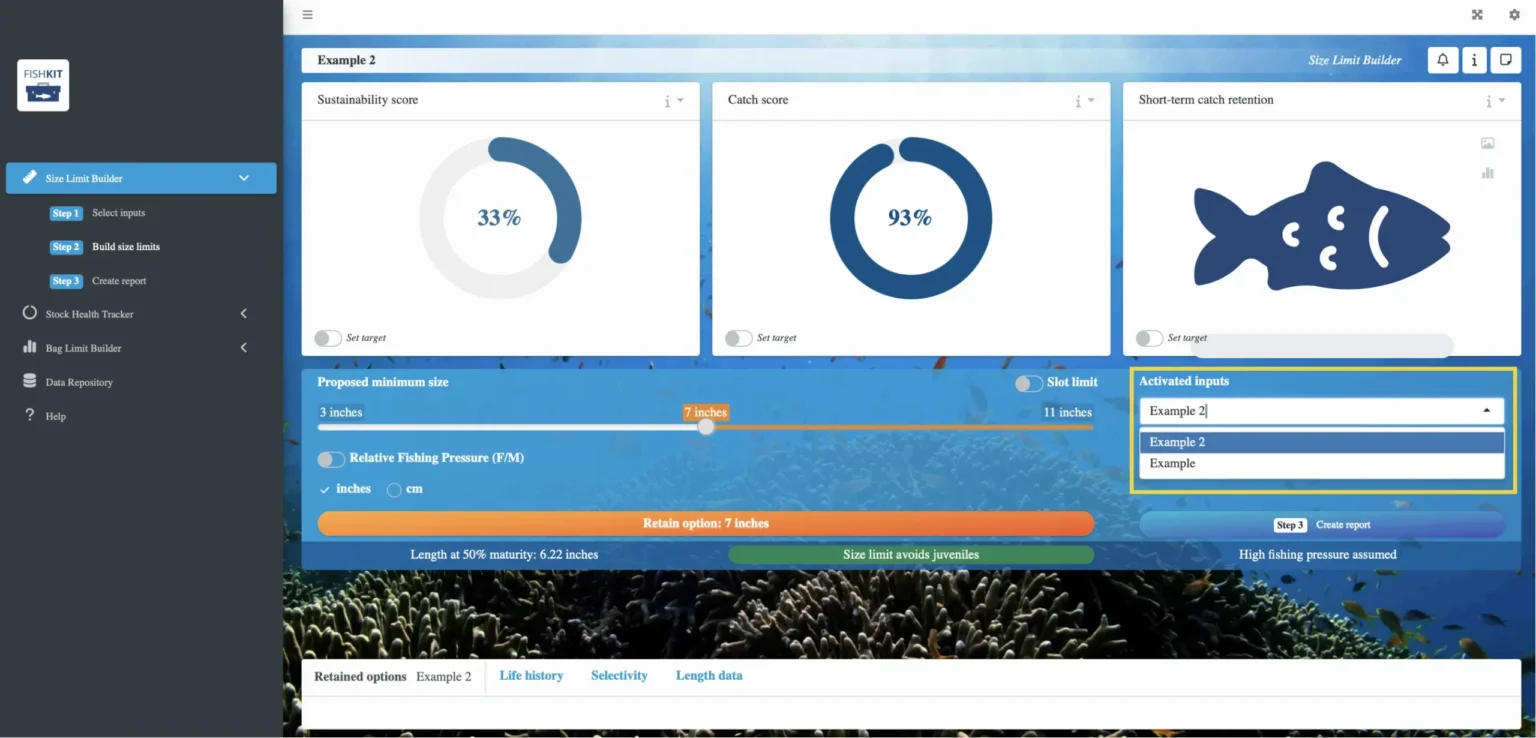
Multiple activations: If you made multiple activations on the previous “Activate” page, you can toggle between them using the dropdown menu under “Activated inputs” on the right side of your screen. Changing the activated input will automatically update the dials and the rest of the information on the Size Limit Builder dashboard.
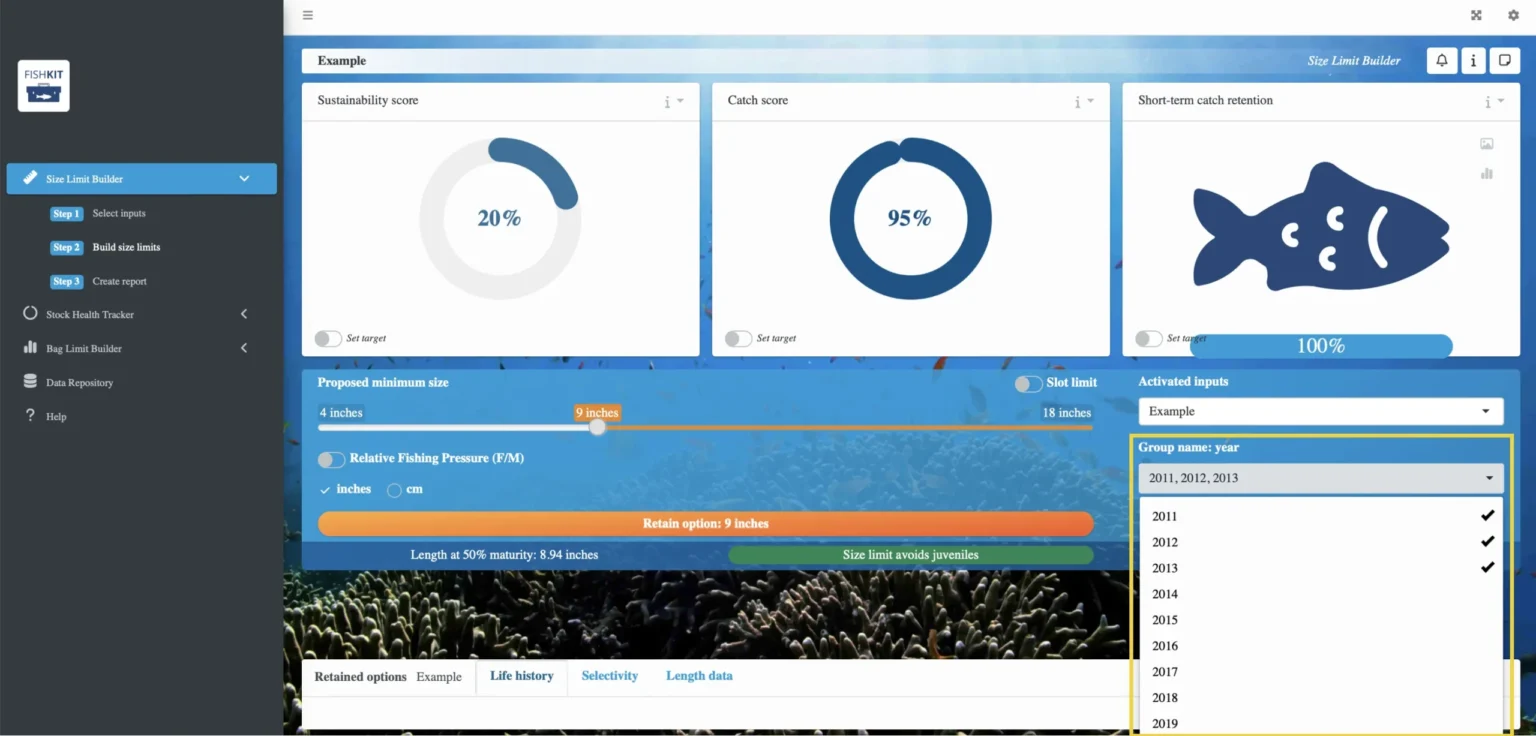
Length data: If you uploaded a length data set and it has groups (e.g., year of data collection), you can select the specific group of interest to look specifically at that group in the dashboard. You can also select multiple groups to look at their data combined. Selected groups will have a check mark next to them and be listed together in the “Group name” dropdown.
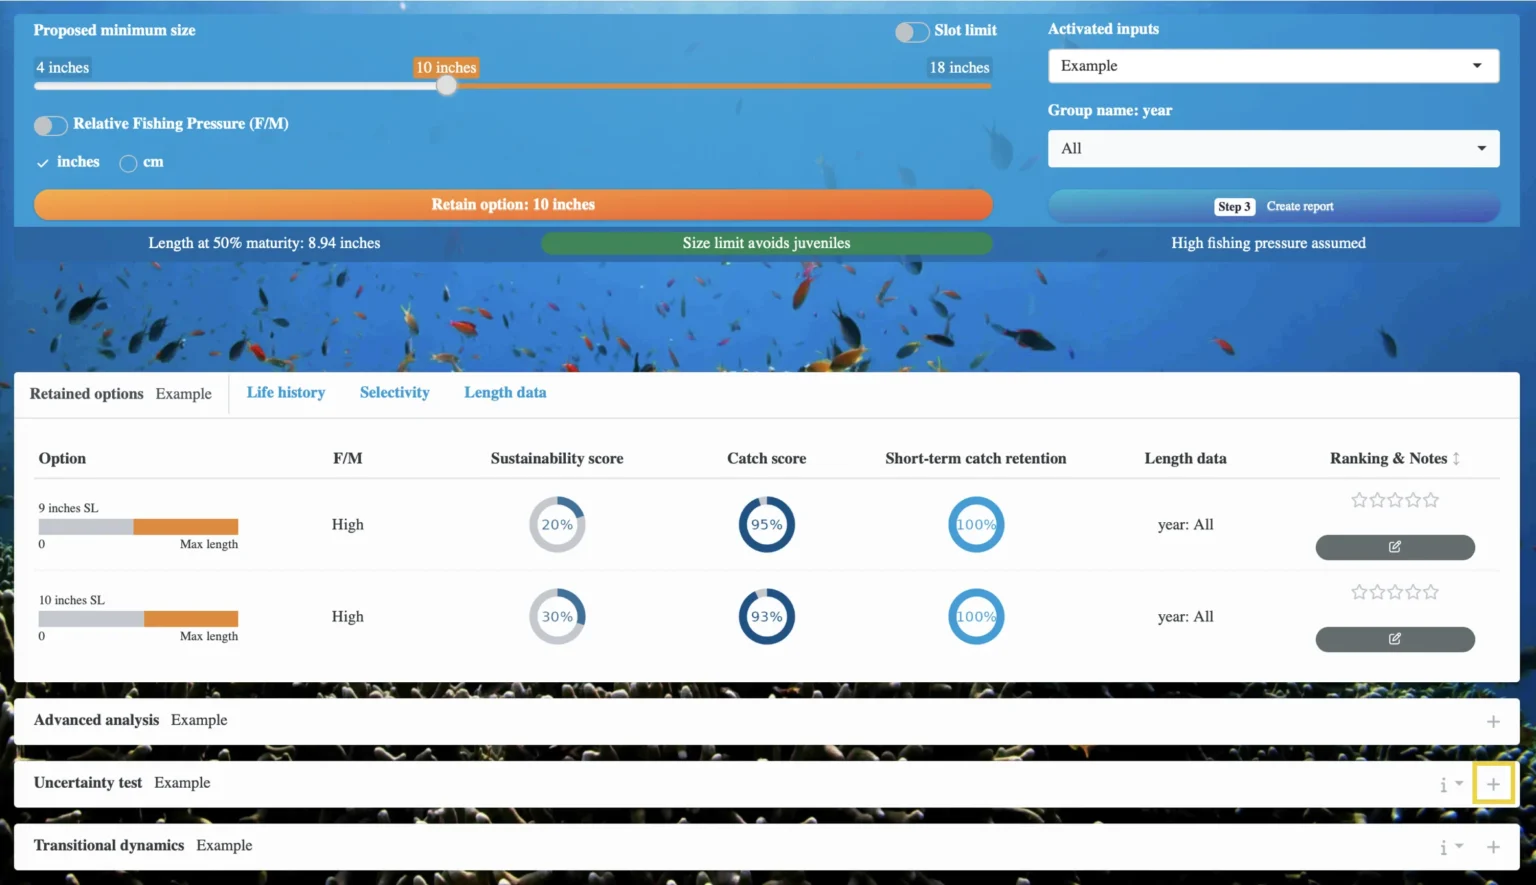
2.d. Retain size limit options
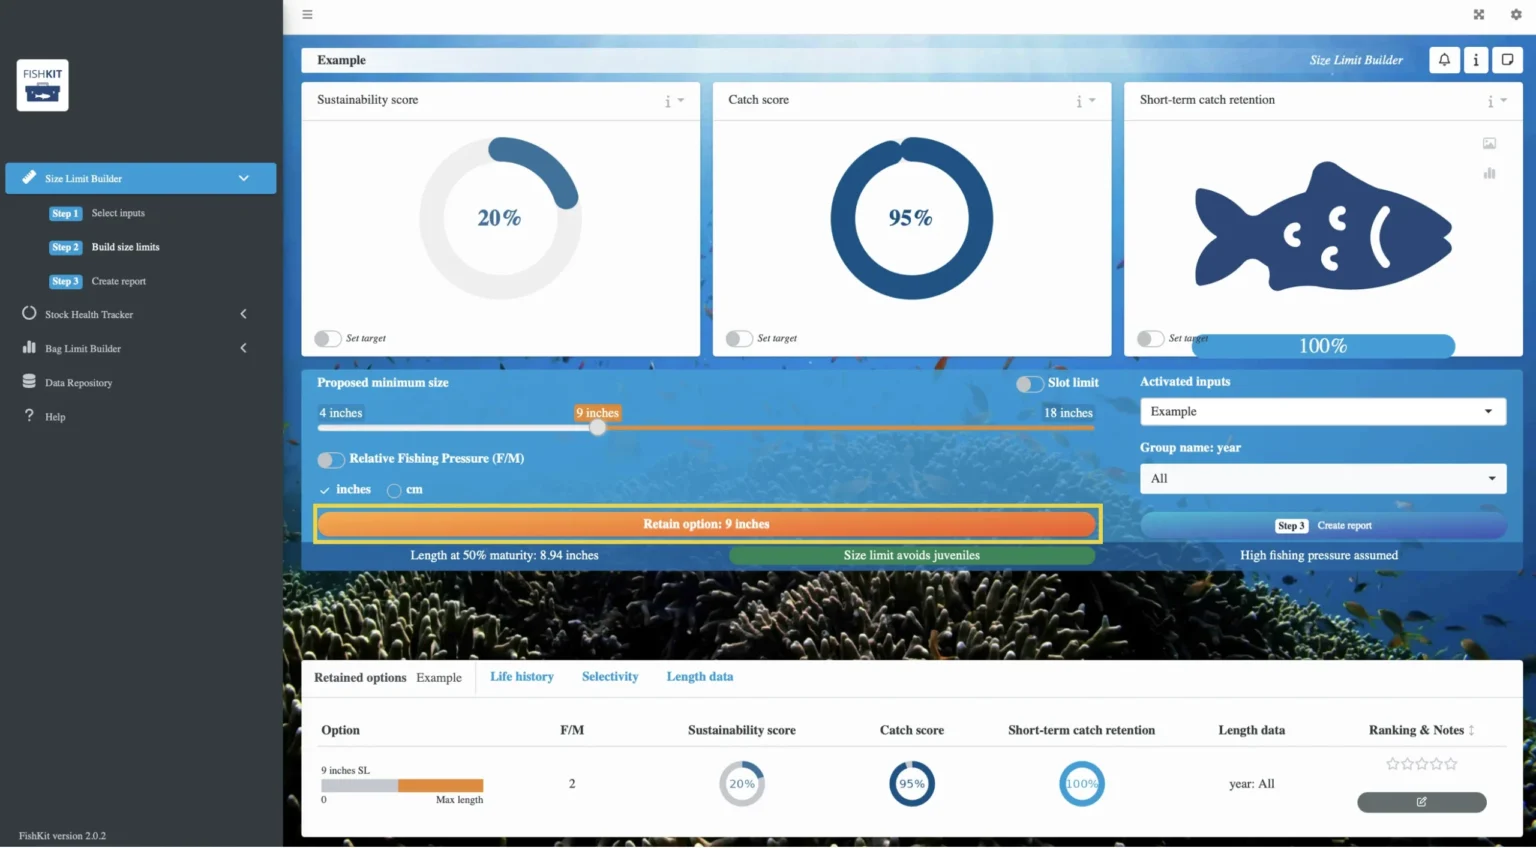
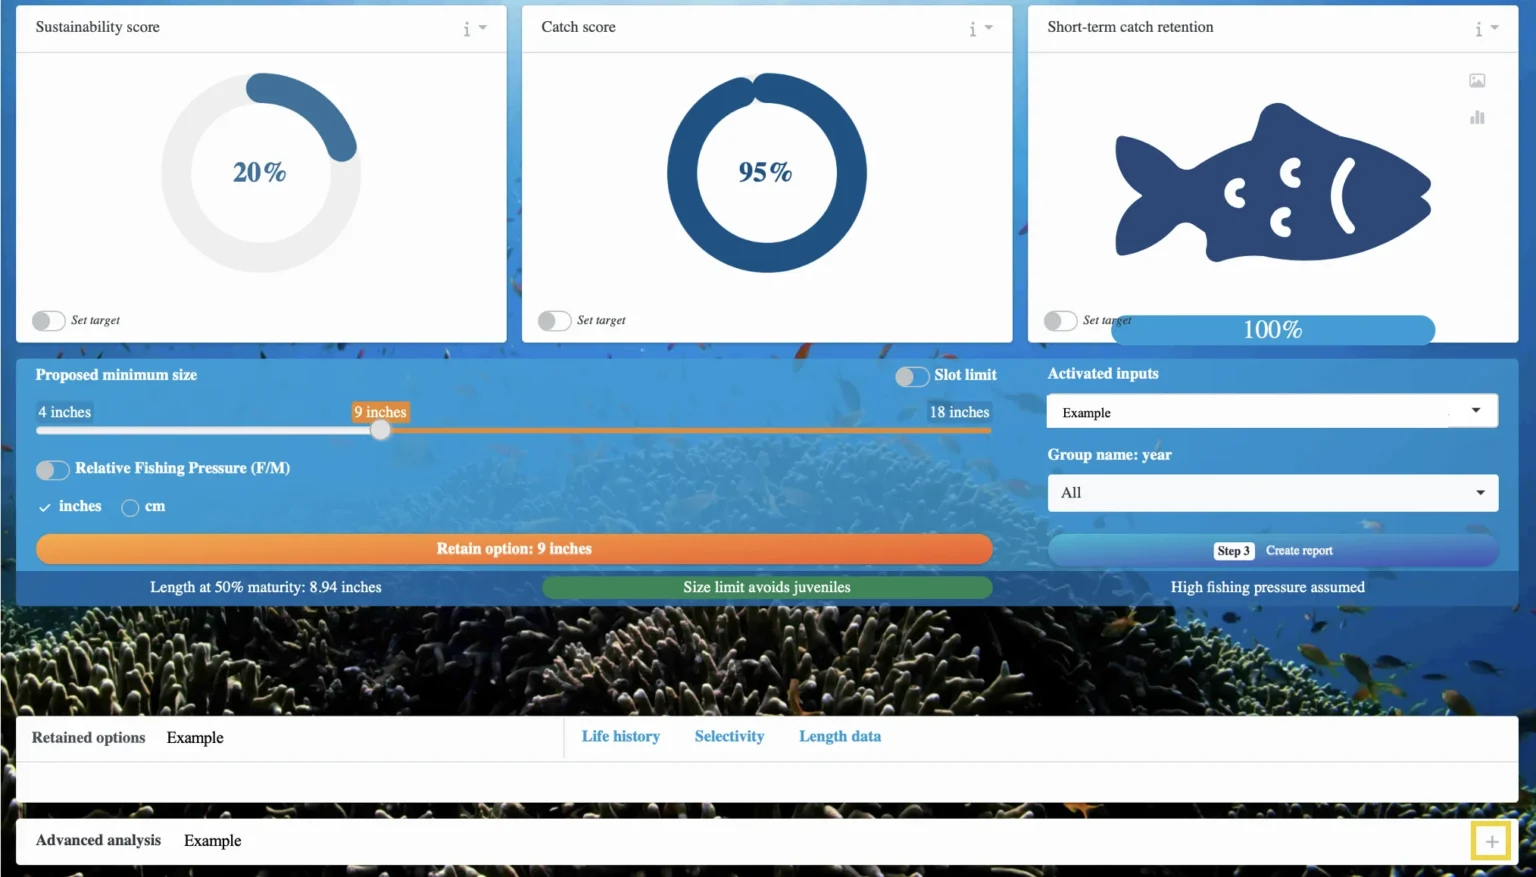
As you move the orange slider, you can view different minimum size limits and their respective sustainability and catch scores. If you included length data in your activation, you can also see the effects of different size limits on the short-term catch retention score. Once you’ve landed on a score that you’d like to retain, click on the orange “Retain option” button to save that size limit option. Once you’ve retained an option, you can scroll down to see it displayed below.
You can then add a rating and notes about the size limit in the “Retained options” tab in the last column. This notes feature may be useful in a community meeting setting in order to capture notes about perspectives on different size limit options.
You can repeat this process for as many size limits as you like, and the FishKit app will retain your progress by saving the size limits in the “Retained options” tab.
If you have multiple activations, you can toggle between them and save size limits specific to each activation. The “Retained options” tab will update to correspond with your current selected activation, keeping your size limit options separate between the activations.
Note that you can also set size limits in either inches or centimeters, just click on the option you prefer above the orange “Retain option” button.
- More information on size limits
2.e. Additional Size Limit Builder dashboard features (optional)
There are additional options for customizing your Size Limit Builder dashboard experience.
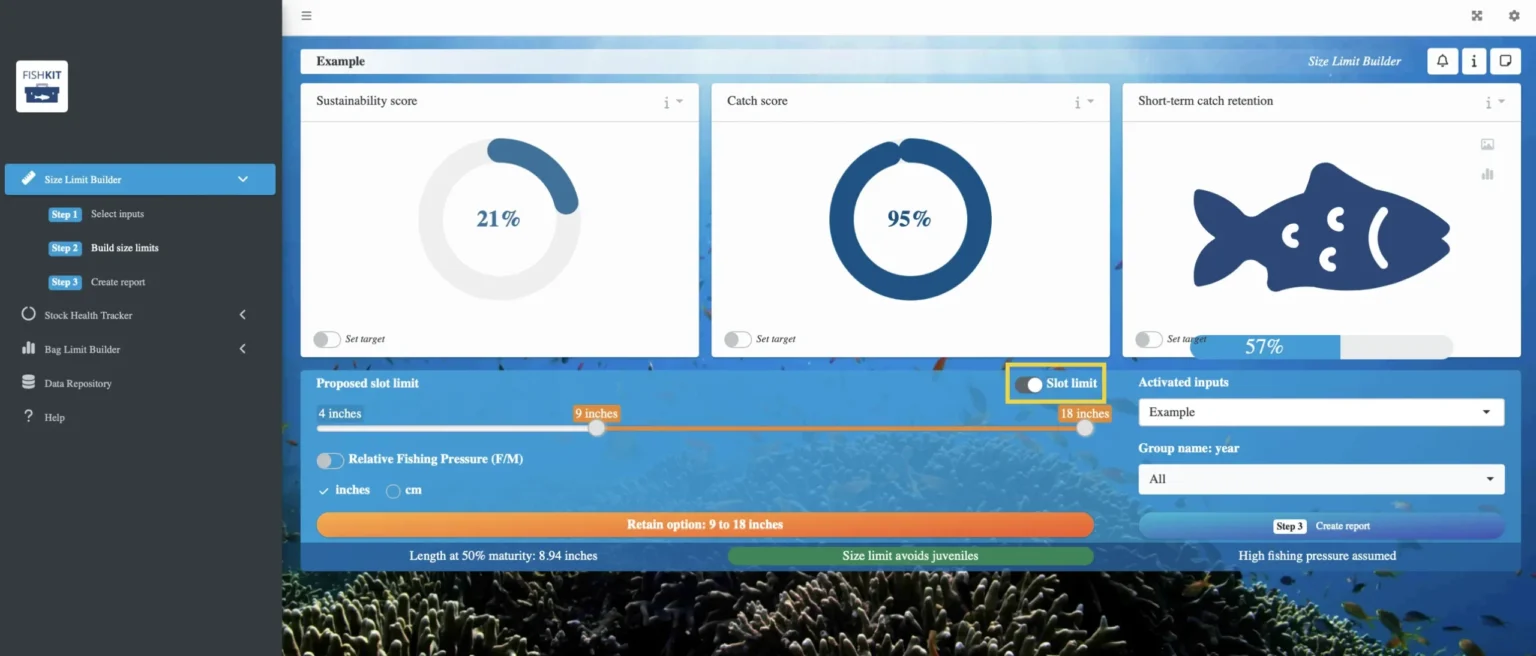
Slot limits: Minimum size limits are the default type of size limit in the Size Limit Builder; however, you can also explore the effects of slot limits. To access slot limits on the dashboard, click the toggle next to “Slot limit” under the three main dials.
You can then click and drag a minimum and maximum size limit on the size limit scale bar to see how a slot size limit would impact sustainability, catch, and short-term catch retention if you included length data in your activation. A (harvestable) slot limit is defined as the interval within which capture may occur. You can retain options from both minimum size limits and slot limits in the same session. Just toggle the slot limit on and off to switch back and forth between minimum size limits and slot limits.
Target scores: You can also set individual targets for the sustainability score, catch score, and short-term catch retention score if you included length data in your activation. Set a score by clicking on the toggle at the bottom of the desired score box. Enter in a number between 1 and 100 to specify the target for that score. Using this function helps visualize when a target is being met, as the header for the score will turn green when the score meets or exceeds the target.
Relevant Modules:
3. Create report
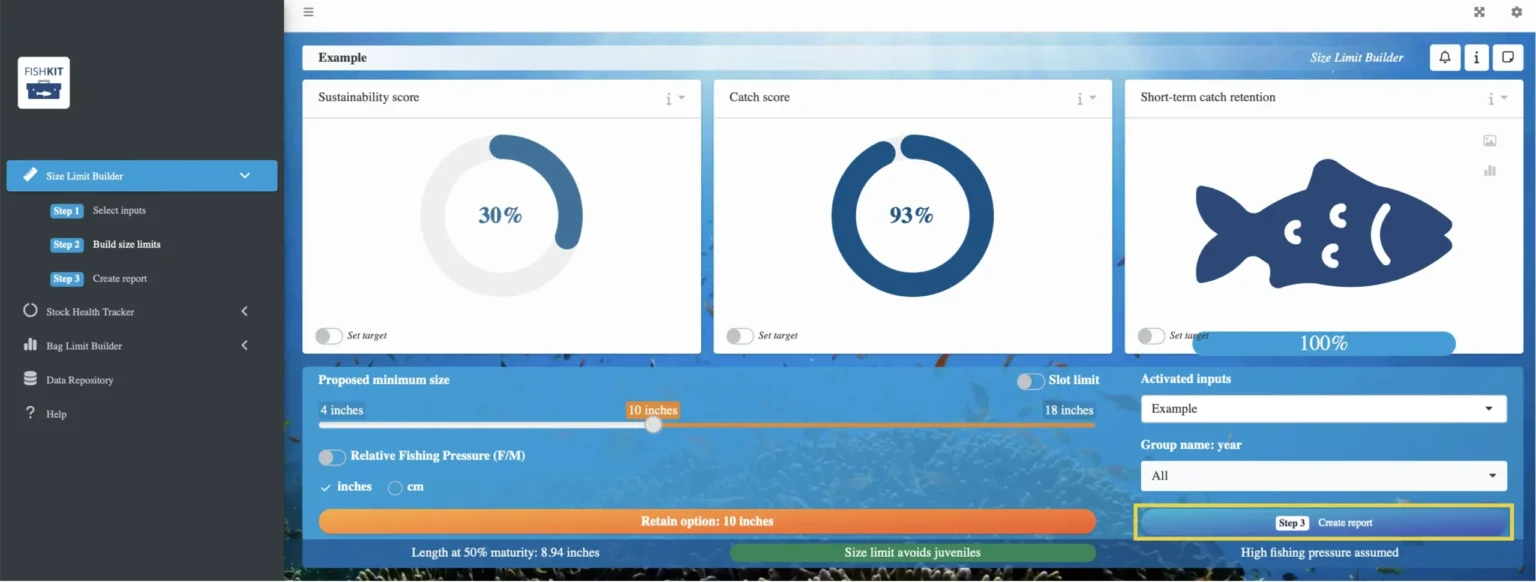
Once you’re satisfied with your session or ready to close out of the app, select “Step 3: Create report” to export a PDF detailing your session.
Make sure your desired activation(s) are selected, and add a report title and author(s) if you’d like. If you’re willing to share your report with the FishKit team, so we can get a better idea of how the FishKit app is being used and better serve FishKit users like you, check “Yes” under “I agree to share the results of my FishKit session with the FishKit team.”
Note that any sharing will be of aggregated data that will be disassociated from the user and fishery of origin. Please review the FishKit Terms of Use for more information.
Then, select what you’re using the tool for from the dropdown menu. Lastly, click the orange “Create report” button, which will download the report to your computer.
You can continue to explore the Size Limit Builder with as many life histories and reports as you’d like!
Relevant Modules:
Interpreting results
Sustainability score: This is also known as spawning potential ratio (SPR) in fisheries science. A score of 0% indicates there are no fish left in the population, while a score of 100% indicates the population is unfished. A low sustainability score equates to low potential for population replenishment, meaning there could be population decline.
While optimal values for this metric vary for different species, under sustainable harvest, values ranging from 30%-40% are generally a good target reference point. Setting a target sustainability score for your species of interest should be based on your community’s needs and priorities, as well as the fish species’ life history information and current stock status.
It is also important to note that the sustainability score represents an equilibrium score, or the score you can expect to see in the long term, once the fish population has stabilized after the implementation of a size limit. Importantly, this value assumes there is 100% compliance with the size limit for the entire fishery.
Catch score: This is also known as yield per recruit (YPR) in fisheries science. A score of 0% indicates no fishing is occurring, and a score of 100% indicates maximum yield is reached. The catch score is calculated as a percentage relative to the maximum yield for the fishery. Therefore, larger percentages indicate a catch closer to the maximum possible catch for the fishery, and a greater yield in weight.
A score of 80% can serve as a target for “pretty good yield,” acknowledging limitations in achieving maximum yield and instead targeting a satisfactory level of YPR.
Like the sustainability score, the catch score is also an equilibrium score, or the score you can expect to see in the long term, once the fish population has stabilized after the implementation of a size limit.
If you are interested in what catch might look like in the short term, see the metric “short-term catch retention score” below.
Short-term catch retention score: If you choose to upload length data for use in the Size Limit Builder, you will see a third dial at the top of the Size Limit Builder dashboard: “Short-term catch retention score.” Short-term catch retention is the percentage of catch in weight that will be retained immediately after implementing a size limit. While the sustainability and catch scores are equilibrium (long-term) scores, the short-term catch retention score provides insight into the composition of a fishery’s catch in the short term.
Guidance for evaluating and setting size limits: Use the sustainability score, catch score, and short-term catch retention score (if available) for different size limits to help inform a size limit decision. Selecting a size limit that balances sustainability and catch should allow for continued fishing in the present, as well as fishing into the future, as the population should be able to replenish itself.
In general, a good balance of sustainability and catch is a sustainability score somewhere in the 30%+ range (assuming 100% compliance with the size limit), and a catch score somewhere in the 80%+ range. However, these targets will shift depending on the species and its life history, as well as local context and current stock health. Consult a fisheries scientist to help identify suitable targets for your fishery.
Additionally, a size limit should typically be above the length at 50% maturity to protect juveniles and ensure population replenishment.
The metrics in the Size Limit Builder should complement local and traditional knowledge when selecting a size limit. Community buy-in is imperative for ensuring a size limit is actually implemented, enforced, and ultimately successful.
- Transitional dynamics to understand temporal dynamics
- Sustainability score and catch score
Advanced functions
These functions include advanced analysis, uncertainty tests, and transitional dynamics, and they are geared towards more technical users trained in fisheries science.
Relevant Modules:
Advanced analysis function
The “Advanced analysis” tab on the Size Limit Builder dashboard gives more detailed insight into the sustainability and catch scores. To use and access the advanced analysis section, follow these steps:
Relevant Modules:
1-2. Select inputs and build size limits
The advanced analysis feature is housed within the Size Limit Builder. To use the advanced analysis feature, start by completing steps 1-2 of the “Steps for use” section above.
Relevant Modules:
1-2.b. Interpret advanced analysis information
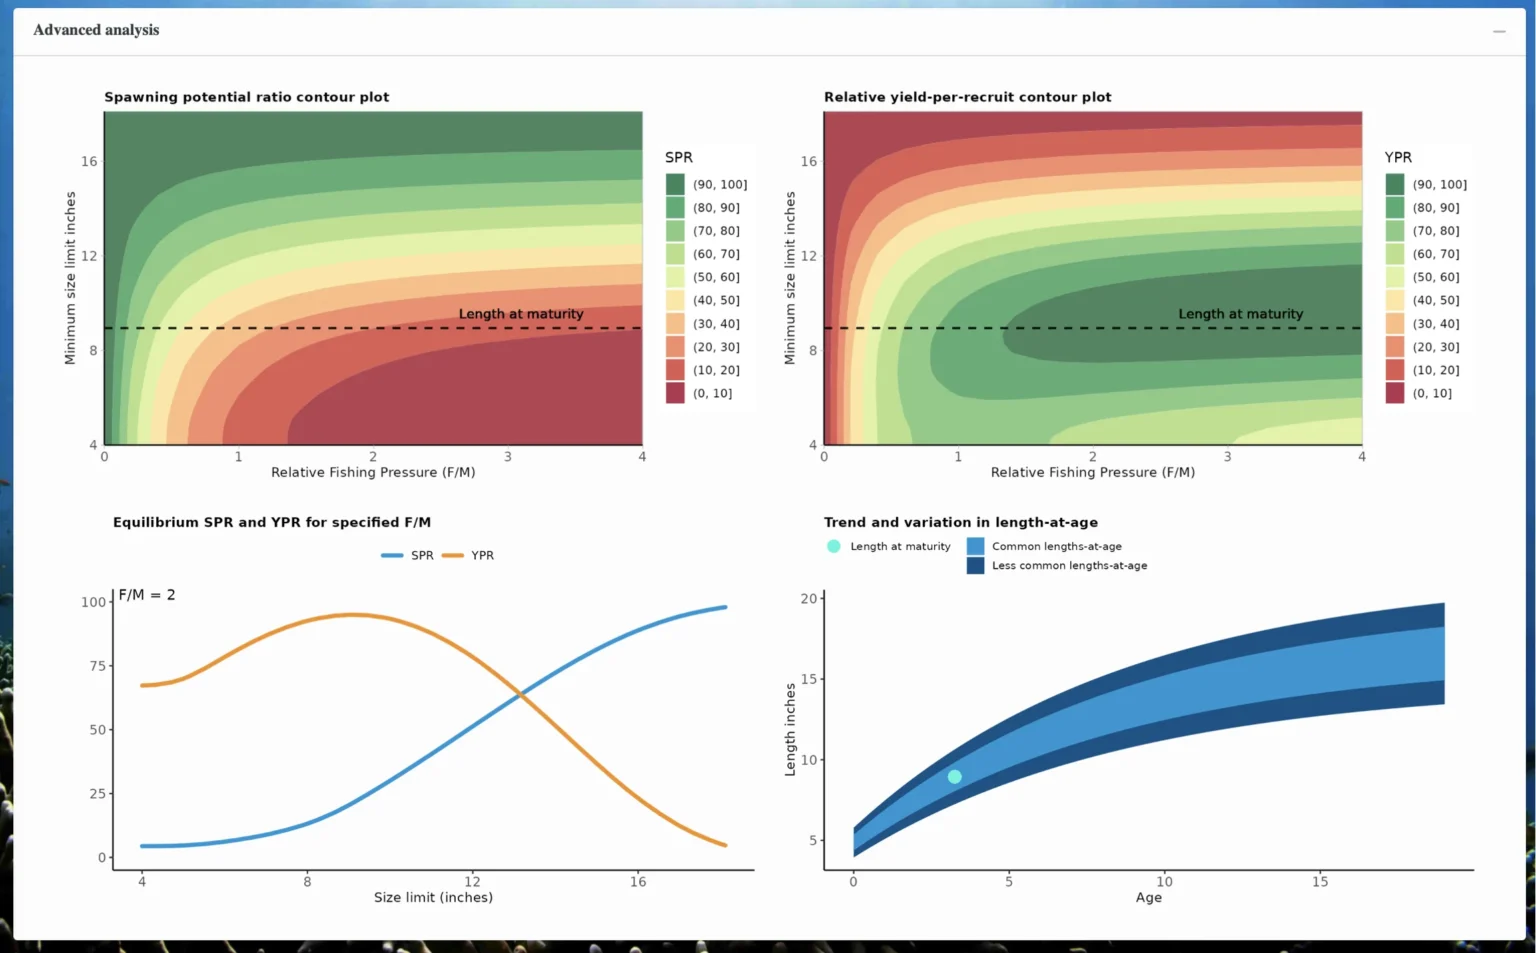
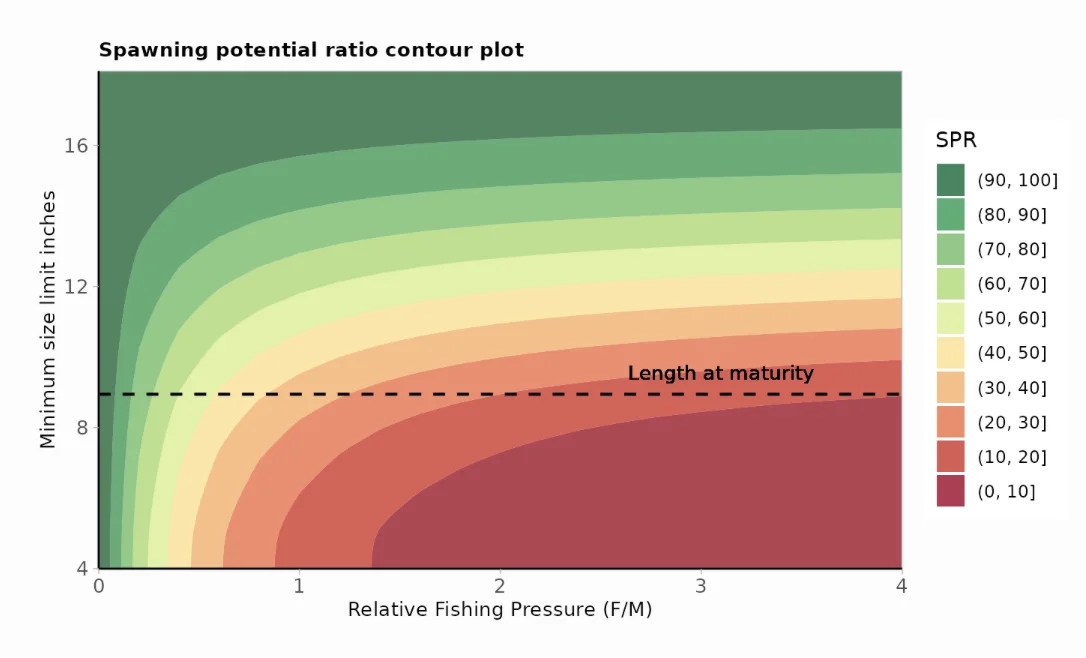
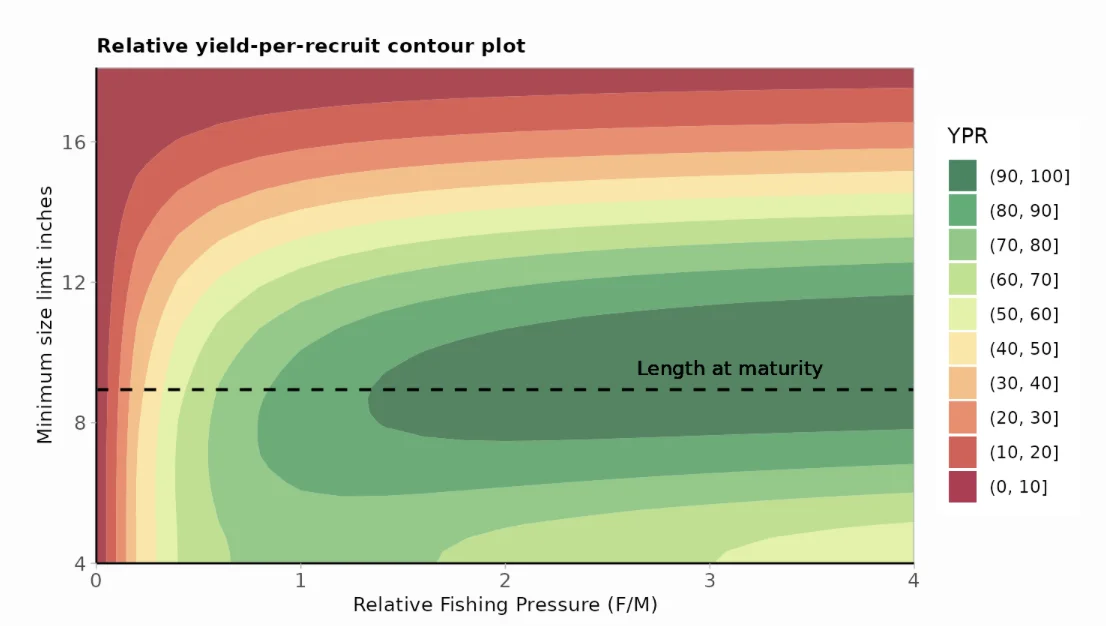
Here, you will see four graphs. The top left graph represents spawning potential ratio (SPR, the “sustainability score”), and the top right graph represents yield per recruit (YPR, the “catch score”).
Conceptually, SPR generally increases with larger size limits because a greater number of fish, and bigger fish, are left in the water to reproduce. SPR generally decreases with increased relative fishing mortality because more fish are being removed from the population and fewer fish are left in the water to reproduce.
For example, on this graph, if you had a relative fishing mortality of 3 and a size limit of 8 inches, you would legally be able to catch below the length at maturity (~9 inches), and you would have a SPR value in the dark red range, indicating a score of somewhere between 0 and 10%. However, if you kept relative fishing mortality at 3, but instead set a size limit of 12, you would no longer be catching juvenile fish, and you would have a SPR value in the light yellow/green range, somewhere between 40 and 60%.
YPR is generally the largest with a size limit somewhere around the length at maturity and under higher relative fishing mortality because these conditions enable the greatest amount of catch. High fishing mortality equates to more fishing, which means greater catch and a greater YPR value. Regarding size limits, allowing fishing to occur below the length at maturity by setting a small size limit leads to a lower YPR because it reduces population replenishment and can lead to population decline, limiting the available fish to catch in the future. Limiting fishing to sizes significantly above the length at maturity with a large size limit leads to a lower YPR because it greatly reduces the legally harvestable fish population.
For example, on this graph, if you have a relative fishing mortality of 3 and a size limit of 5 inches, you would legally be able to catch fish below the length at maturity (~9 inches), and you would have a YPR in a mid-green range, somewhere between 60 and 70%. However, if you kept relative fishing mortality at 3, but instead set a size limit of 10, you would have a YPR value in the dark green range, somewhere between 90 and 100%.
Equilibrium SPR and YPR for specified F/M plot: The bottom left graph illustrates how SPR and YPR change across size limits at a set fishing mortality. Size limits are on the x-axis, and SPR and YPR scores increase from 0 to 100 on the y-axis. SPR is represented by the blue line, and YPR is represented by the orange line.
Generally, both YPR and SPR increase with increasing size limits up to a certain point, and then SPR continues to increase while YPR decreases. This inflection point is somewhere around the length at maturity for the fish species.
For example, in this graph, YPR and SPR increase to somewhere around 9 inches, which is right around the length at maturity.
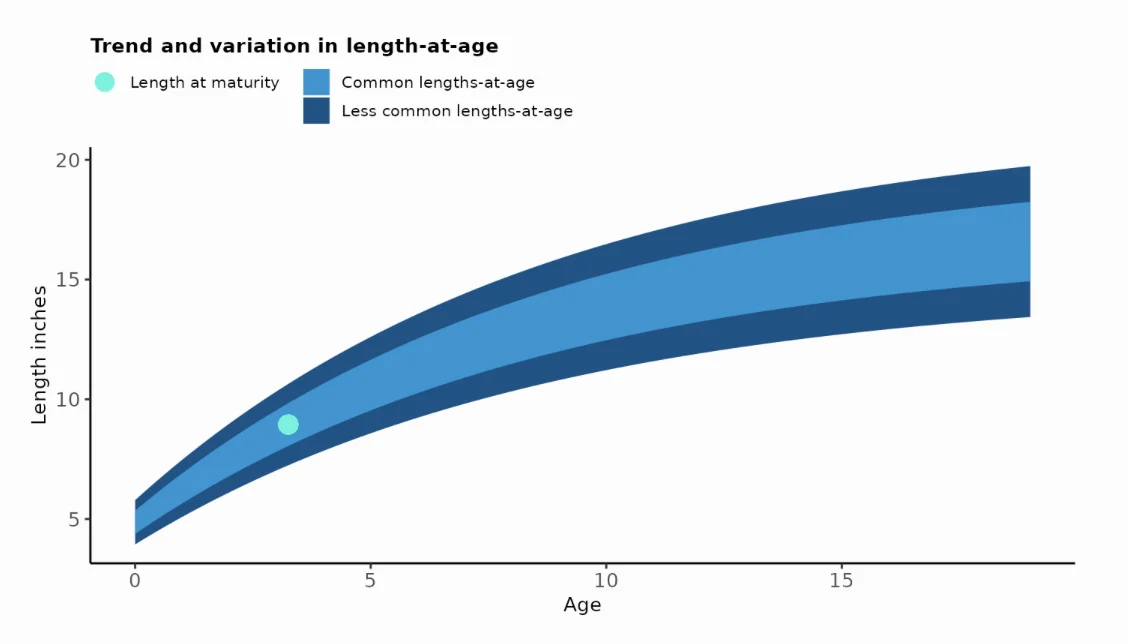
Trend and variation in length-at-age plot: The bottom right graph illustrates the relationship between fish length and age for the given species. Fish age is on the x-axis, and fish length is on the y-axis. The bright blue point indicates the length at maturity. The light and dark blue areas represent the range of fish lengths at each age. The most common length range for each age is represented by the light blue area, and the less common length range is represented by the dark blue area.
For example, on this graph, you might find a 10-year-old fish that is ~12 inches long, or a 10-year-old fish that is ~16 inches long, which would both fall in the dark blue ranges and represent less common lengths. More commonly, you would find a 10-year-old fish that is somewhere between the 12 and 16 inch lengths, in the light blue shaded area of the graph.
3. Create report
Once you’re satisfied with your session or ready to close out of the app, select “Step 3: Create report” to export a PDF detailing your session. The first two advanced analysis graphs will automatically be included in the report.
Make sure your desired activation(s) are selected, and add a report title and author(s) if you’d like. If you’re willing to share your report with the FishKit team, so we can get a better idea of how the FishKit app is being used and better serve FishKit users like you, check “Yes” under “I agree to share the results of my FishKit session with the FishKit team.”
Note that any sharing will be of aggregated data that will be disassociated from the user and fishery of origin. Please review the FishKit Terms of Use for more information.
Then, select what you’re using the tool for from the dropdown menu. Lastly, click the orange “Create report” button, which will download the report to your computer.
Relevant Modules:
Uncertainty test function
The “Uncertainty test” tab on the Size Limit Builder dashboard provides insight into the degree to which the sustainability and catch scores for specified management options are sensitive to specific life history or fishing mortality parameters. It allows you to modify parameters and re-calculates the sustainability and catch scores to provide this insight. To use and access the uncertainty test section, follow these steps
- Uncertainty in resource state and in life history
1-2. Select inputs and build size limits
The uncertainty test feature is housed within the Size Limit Builder. To use the uncertainty test feature, start by completing steps 1-2 of the “Steps for Use” section above.
Relevant Modules:
1-2.a. Retain size limit options
After completing steps 1-2 of the “Steps for Use” section of the Size Limit Builder, you should be at the Size Limit Builder dashboard page.
Before running the uncertainty test, you will need to retain at least one size limit. Uncertainty tests are used to compare a given retained option under different scenarios about life history parameters or fishing mortality.
Towards the top of the Size Limit Builder dashboard, move the orange slider to a size limit you would like to retain, and press the orange “Retain option” button. You can retain as many size limits as you’d like to analyze with the uncertainty test function.
Relevant Modules:
1-2.d. Specify uncertainty test
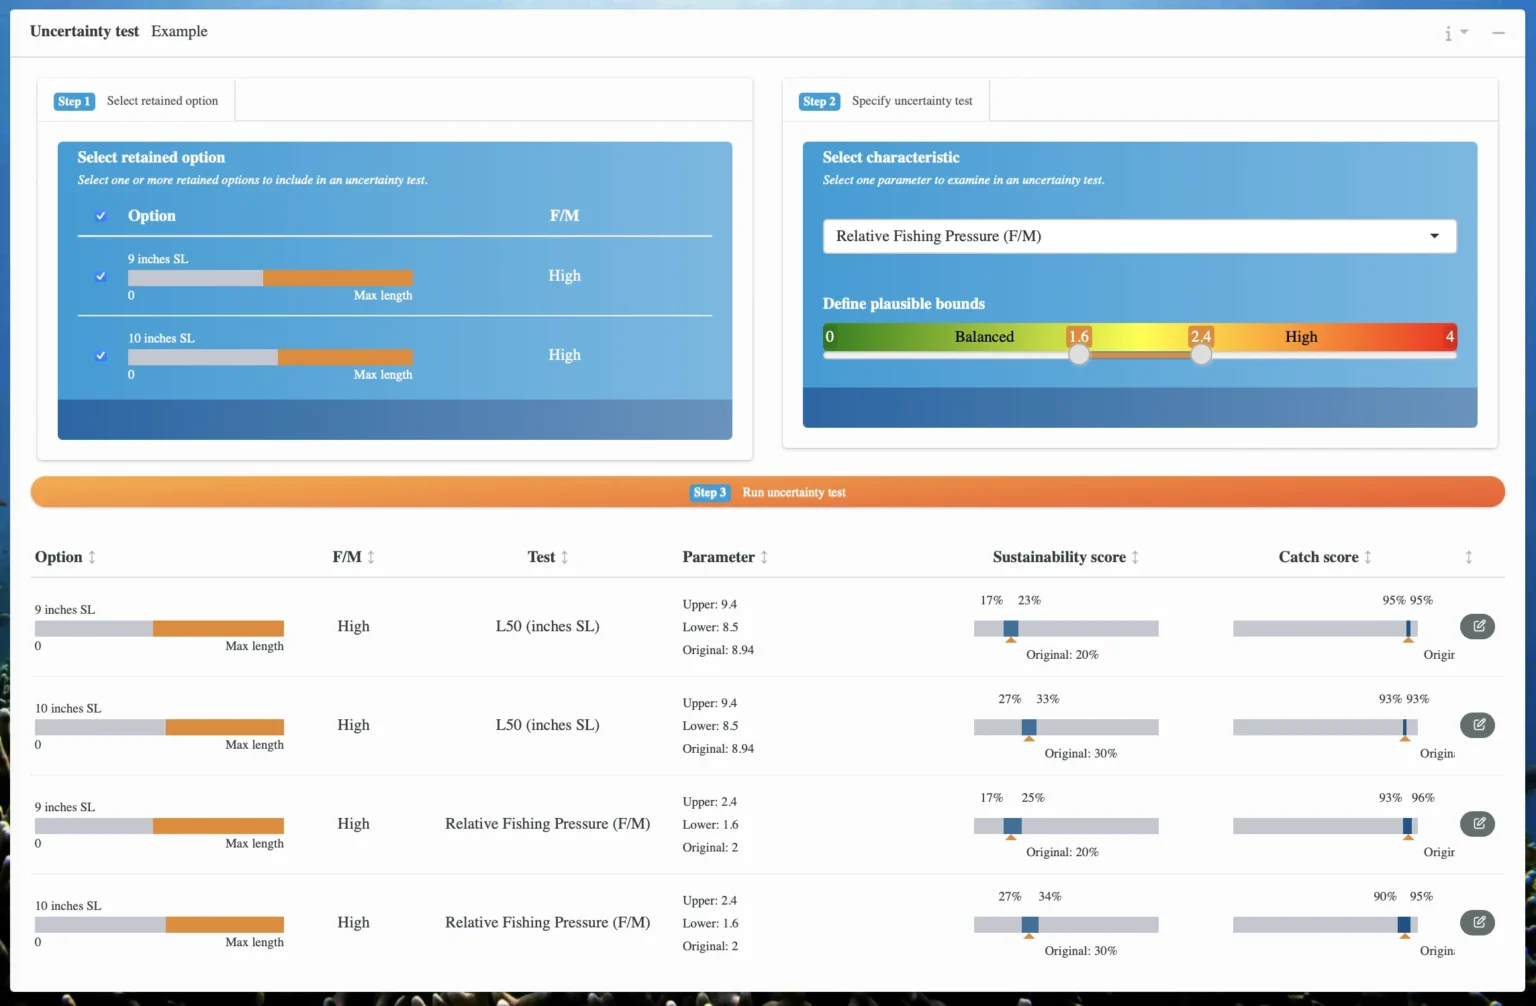
Then, in the box on the right, select the characteristic you want to examine in the uncertainty test. Use the dropdown menu to select a life history parameter or fishing rate. Then, use the slider to set an upper and lower bound. Upper and lower bounds are not used to define a statistical sampling distribution; rather, two discrete uncertainty tests are run, one at the lower bound and a second at the upper bound.
Note you can only adjust one parameter per uncertainty test. In this way, uncertainty testing is structured as a process for discrete examinations of the effects of modifying one parameter, while maintaining all other parameters at the original values, on the calculation of the sustainability score and catch score. However, if you want to examine multiple parameters, you can repeat these steps to separately run multiple uncertainty tests.
1-2.e. Run uncertainty test
Once all of the information is selected, click on the orange “Step 3 Run uncertainty test” button. Running the uncertainty test will re-calculate the sustainability and catch scores at the lower and upper parameter bounds, producing an expected set of outcomes (lower, original quantity, upper).
Relevant Modules:
1-2.f. View uncertainty test results
Once the uncertainty test has processed, you will see the results organized by each retained option (e.g., size limit) beneath the orange “Step 3 Run uncertainty test” button. Each retained option you ran the test on will have its own row. For each row, the specified size limit will be listed on the left; followed by fishing mortality (F/M); the parameter the uncertainty test was run on (i.e., length at 50% maturity); and the upper and lower values you set for the parameter along with the original parameter value.
Then, the results of the test are given in the two rightmost columns. The sustainability score column shows you what the original sustainability score for that size limit was, which is the same value as the value that was shown on the dial at the top of the dashboard for that size limit. Then, it gives you an upper and lower bound for the sustainability score based on the range of values you selected for the tested parameter. The same information is available in the next column for the catch score.
Relevant Modules:
1-2.g. Run additional uncertainty tests (optional)
If you want to explore uncertainty within different parameters, on different retained size limits, and/or on the same parameter but with different upper and lower bounds, you can run as many additional uncertainty tests as you would like by completing steps B through F of this guide.
The results from each uncertainty test that you run will be added to the rows beneath the orange “Run uncertainty test” button.
Relevant Modules:
3. Create report
Once you’re satisfied with your session or ready to close out of the app, scroll back up to the top of the dashboard and select “Step 3: Create report” to export a PDF detailing your session.
Note that the uncertainty tests you ran will automatically be included in the report. The results can be found under the “Retained options” section in the PDF.
Make sure your desired activation(s) are selected, and add a report title and author(s) if you’d like. If you’re willing to share your report with the FishKit team, so we can get a better idea of how the FishKit app is being used and better serve FishKit users like you, check “Yes” under “I agree to share the results of my FishKit session with the FishKit team.”
Note that any sharing will be of aggregated data that will be disassociated from the user and fishery of origin. Please review the FishKit Terms of Use for more information.
Then, select what you’re using the tool for from the dropdown menu. Lastly, click the orange “Create report” button, which will download the report to your computer.
Relevant Modules:
Transitional dynamics function
The “Transitional dynamics” tab on the Size Limit Builder dashboard provides a temporal component for evaluating size limits. While the sustainability score and catch score dials are equilibrium scores that calculate the end-state effects of a size limit, the “Transitional dynamics” tab addresses changes over time in response to the implementation of a management measure. It visualizes the shift in catch and sustainability from immediately after size limit implementation to the equilibrium sustainability and catch scores.
To use and access the transitional dynamics section, follow these steps:
- More information on Transitional dynamics
1-2. Select inputs and build size limits
The transitional dynamics feature is housed within the Size Limit Builder. To use the transitional dynamics feature, start by completing steps 1-2 of the “Steps for Use” section above.
Relevant Modules:
1-2.b. Specify current fishery characteristics
In the box on the left, you’ll enter in information about the current state of the fishery.
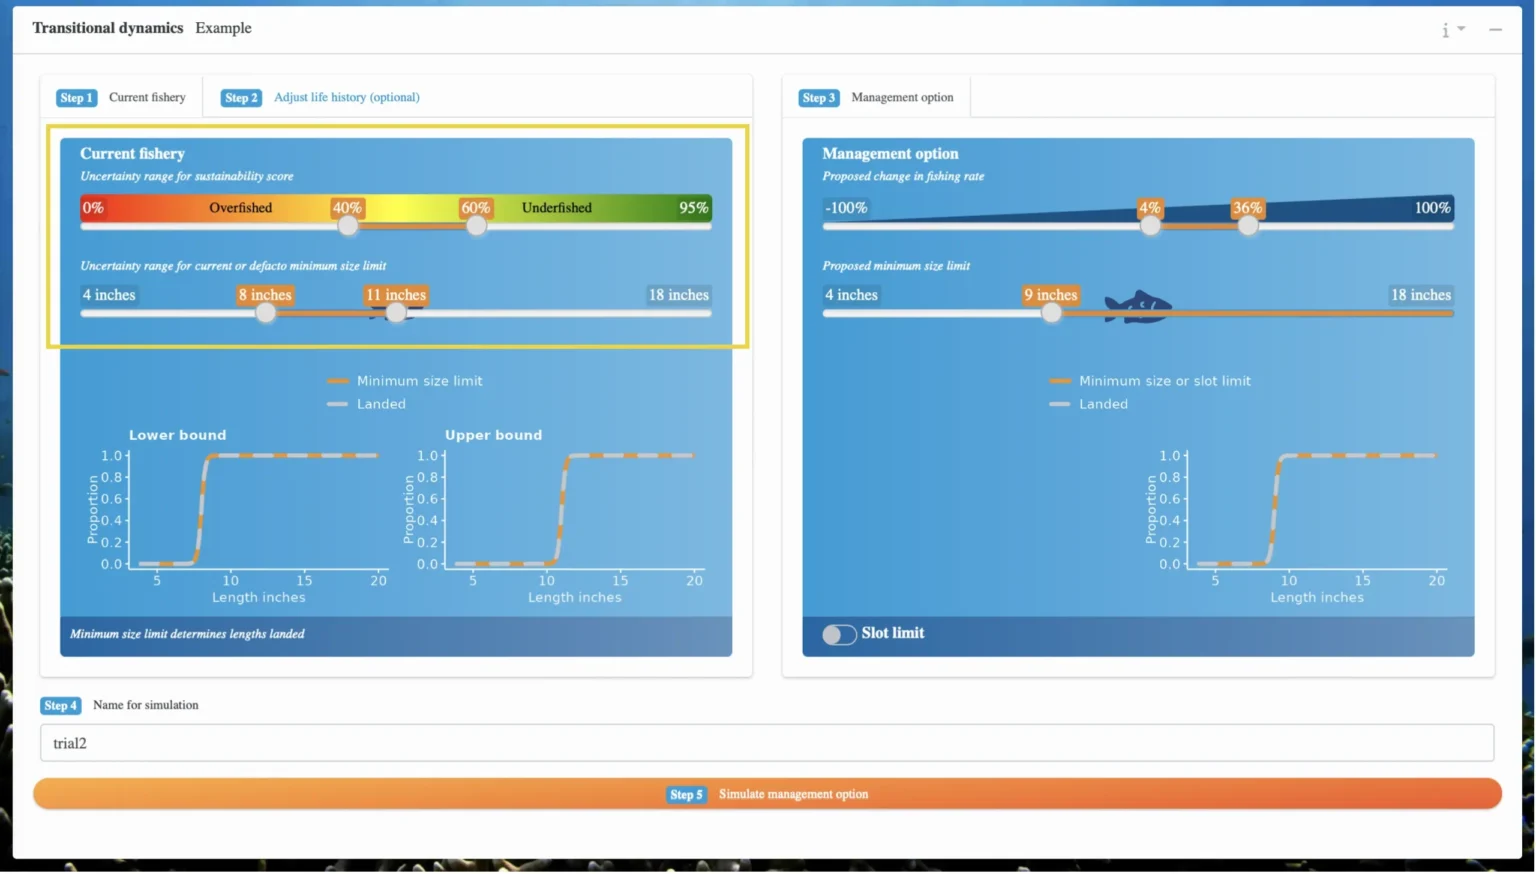
Start by adjusting the slider under the “Uncertainty range for current sustainability score” to estimate the fishery’s current sustainability score/SPR value. You can adjust the nodes to capture the range of potential sustainability scores if there is uncertainty about the actual value.
Then, adjust the slider under the “Uncertainty range for current or defacto minimum size limit” to specify the current minimum size limit. If your fishery has already implemented a formal minimum size limit, you can enter that single number. A quantity or range for this slider must be entered regardless of whether the current fishery has a formal size limit. In the absence of a current size limit, the fishery is likely to know the smaller end of sizes typically retained, owing to traditional practices, market preferences, or availability of fish sizes within a given habitat type.
For example, you can enter the range of the smallest size fish that are normally caught in the fishery. Note that if you use the slider to capture a range of sizes that the range should not represent the whole range of sizes that fishers catch, but rather uncertainty about the smallest size captured.
The graphs below the minimum size limit slider visualize the minimum size limit range that you set, as well as landings.
Relevant Modules:
1-2.c. Adjust life history (optional)
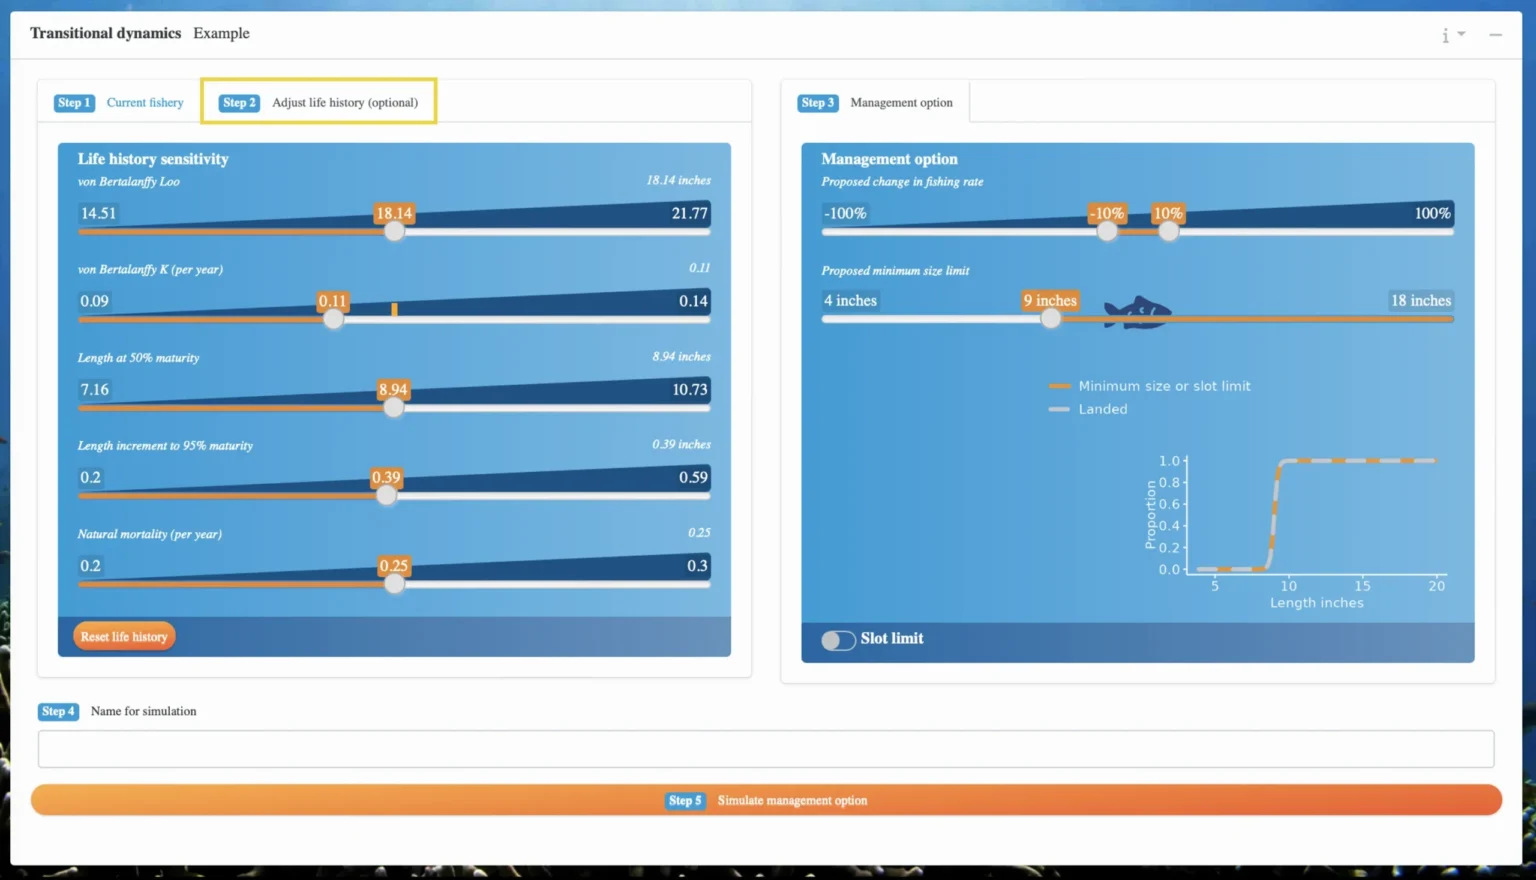
To account for uncertainty in life history parameters for your species, you have the option to modify the parameters by clicking the tab “Step 2 Adjust life history (optional),” next to the current fishery tab you were just editing.
If you want to modify parameters, use the slider next to your desired life history parameter to adjust it.
Adjusting life history parameters allows you to examine discrete scenarios about life history information. You can complete these transitional dynamics steps multiple times, setting different life history parameters each time, to produce a sensitivity analysis based on different life history scenarios.
If you want to go back to the original life history, click the “Reset life history” button at the bottom of the tab.
Relevant Modules:
1-2.d. Specify a management option to examine
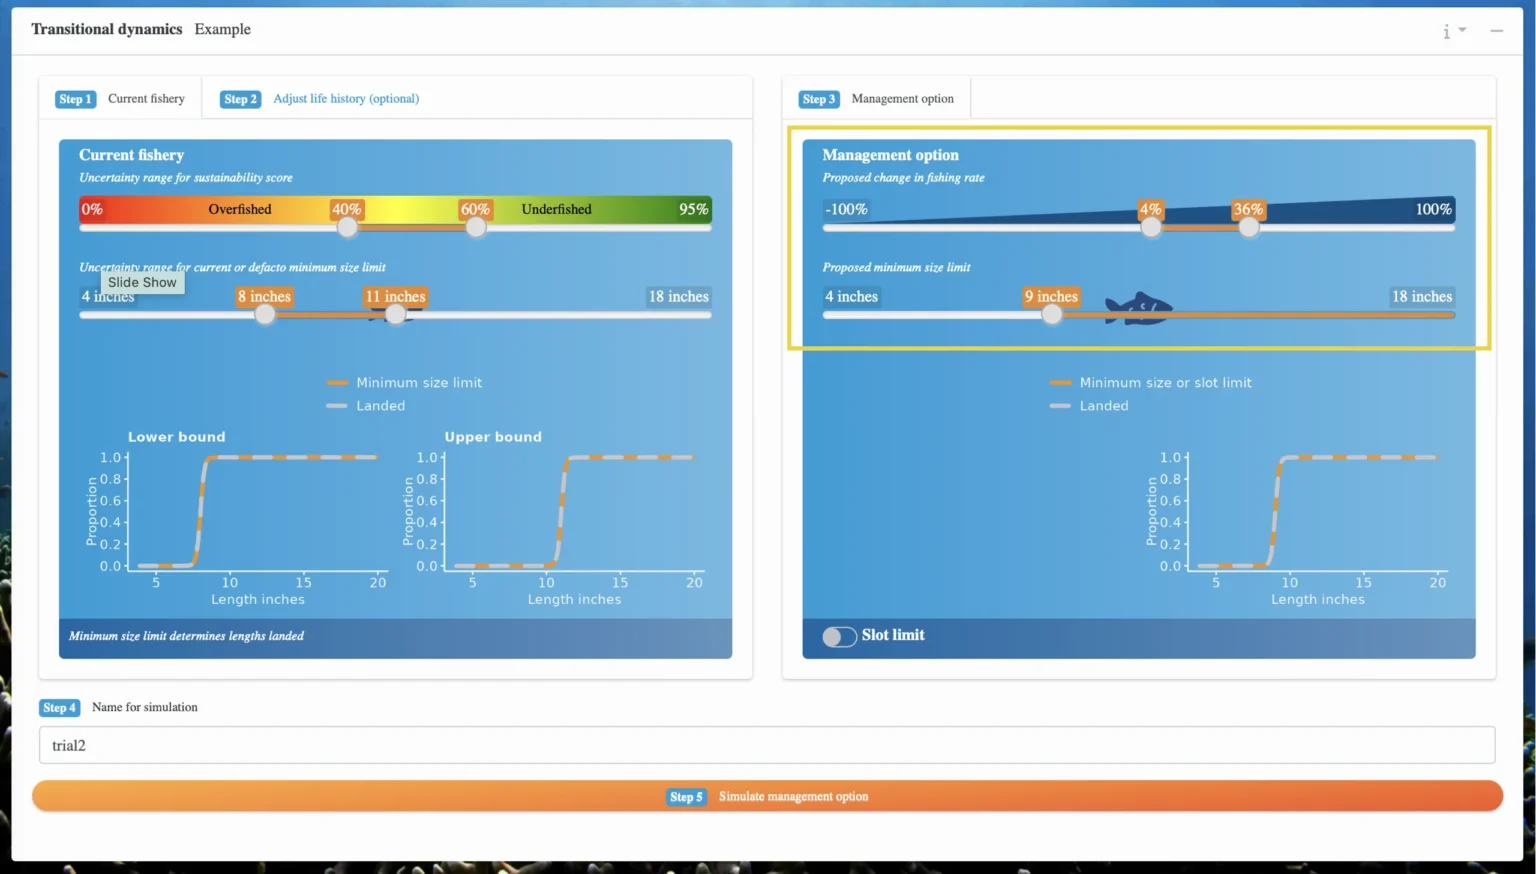
Now, in the box on the right, under the “Step 3 Management option” tab, you’ll enter information about the management option you want to examine to see how it might affect your fishery.
Under the “Proposed change in fishing rate” heading, you can adjust the fishing rate (F) using the slider. In this case, adjusting fishing rate is akin to adjusting fishing effort.
Under the “Proposed minimum size limit” heading, you can specify a minimum size limit to explore by dragging the node to the desired size limit.
The graph below the minimum size limit slider visualizes the minimum size limit range you set, as well as landings.
If you want to explore a slot limit, click on the toggle next to “Slot limit” at the bottom of the blue box. The “Proposed minimum size limit” section will change to a “Proposed slot limit” section, and you can then adjust the slider nodes to your desired slot limit. The graph will update to visualize the slot limit range you set.
Additionally, a percent change in fishing rate, F, (or equivalently percent change in effort, as fishing rate is proportional to effort in the Size Limit Builder) can be specified. Percent change in fishing rate is used to reflect uncertainty, such as future changes in entry to the fishery. Percent change in fishing rate is represented as a uniform distribution, from which independent draws are made during numerical simulation and propagated into projections of temporal dynamics. This input also allows for exploration of scenarios where fishing rate is increased or decreased in the future.
Adjusting both the fishing rate slider and the size limit slider allow you to explore temporal dynamics for scenarios in which fishing effort changes in conjunction with a size limit. If you would like to only explore the temporal dynamics for a size limit but not a change in fishing effort, set the fishing rate slider to 0% by moving both nodes to 0%. If you would like to only explore the temporal dynamics for a change in fishing effort but without the implementation of a size limit, you can set the size limit equal to the size limit you set earlier in the left box, “Step 1 Current fishery.” This will allow you to explore the isolated effect of a change in fishing rate.
Relevant Modules:
1-2.e. Simulate the management option
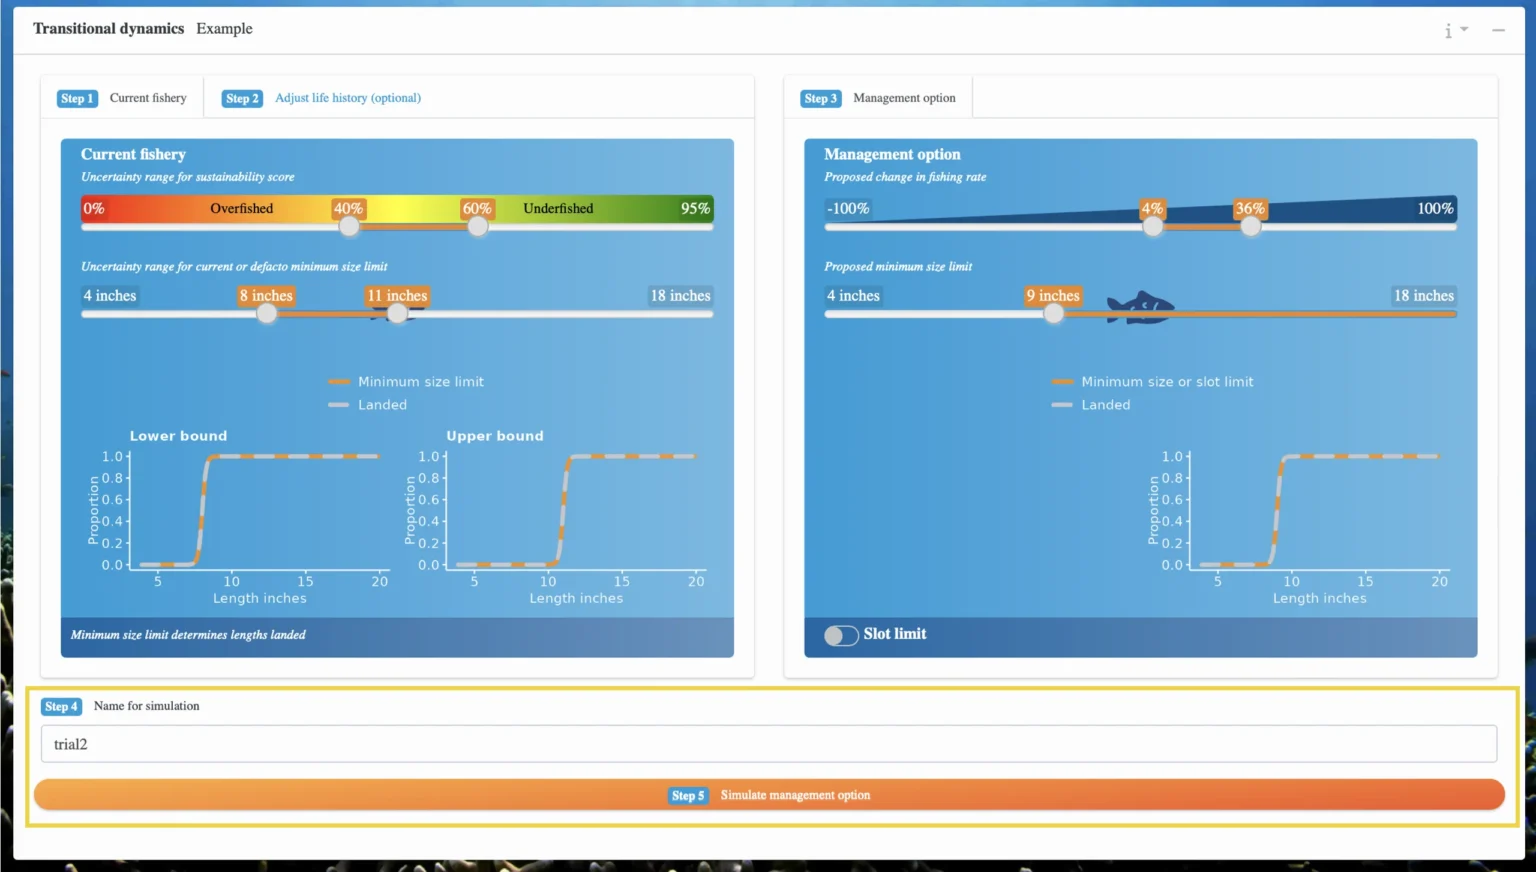
Below the blue boxes, under “Step 4 Name for simulation” enter in a name for your transitional dynamics scenario.
Then, click the orange “Step 5 Simulate management option” button. This will project the fish population forward for 25 years to give you transitional dynamics for the species as well as uncertainty surrounding the estimates.
Fifty replicate simulations or iterations are carried out to balance computation time against reasonable characterization of uncertainty in making projections of population and catch trends. Elements describing key uncertainties (i.e., current SPR, de facto retention, proposed change to fishing rate) are drawn from uniform distributions, producing a slightly different outcome in each iteration, and thus over the course of 50 iterations, uncertainty in projected transitional dynamics is quantified.
Relevant Modules:
1-2.f. Explore the simulation results
Once the simulation has processed, scroll down to see the results. At the top, under “Simulation results,” you will see the name of your simulation.
Then, under “Equilibrium outcomes,” you will see four dials that represent the sustainability and catch scores for the current fishery as well as for the fishery under the management option you specified. The orange values on each dial represent the average value for that score, while the dark blue ranges represent the range of most likely outcomes (the centered 95% of outcomes). The top left dial is the sustainability score for the current fishery, the top right is the sustainability score under the management option, the bottom left is the catch score for the current fishery, and the bottom right is the catch score under the management option.
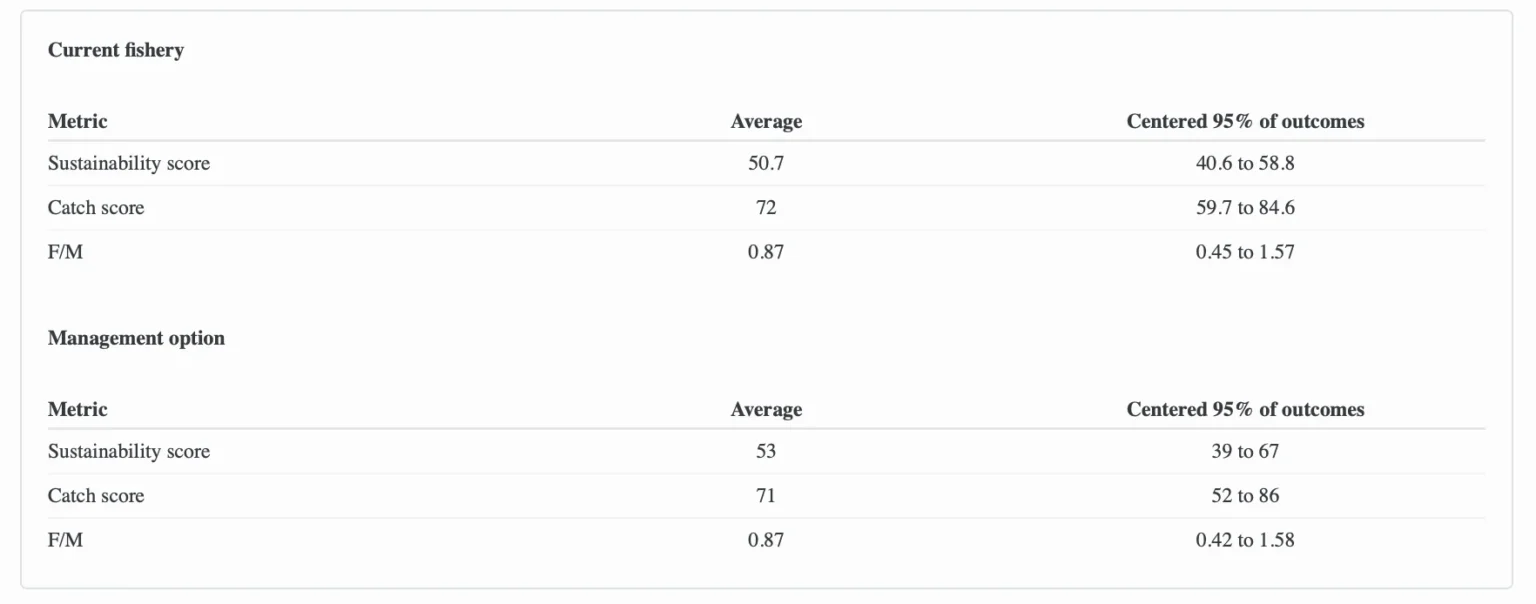
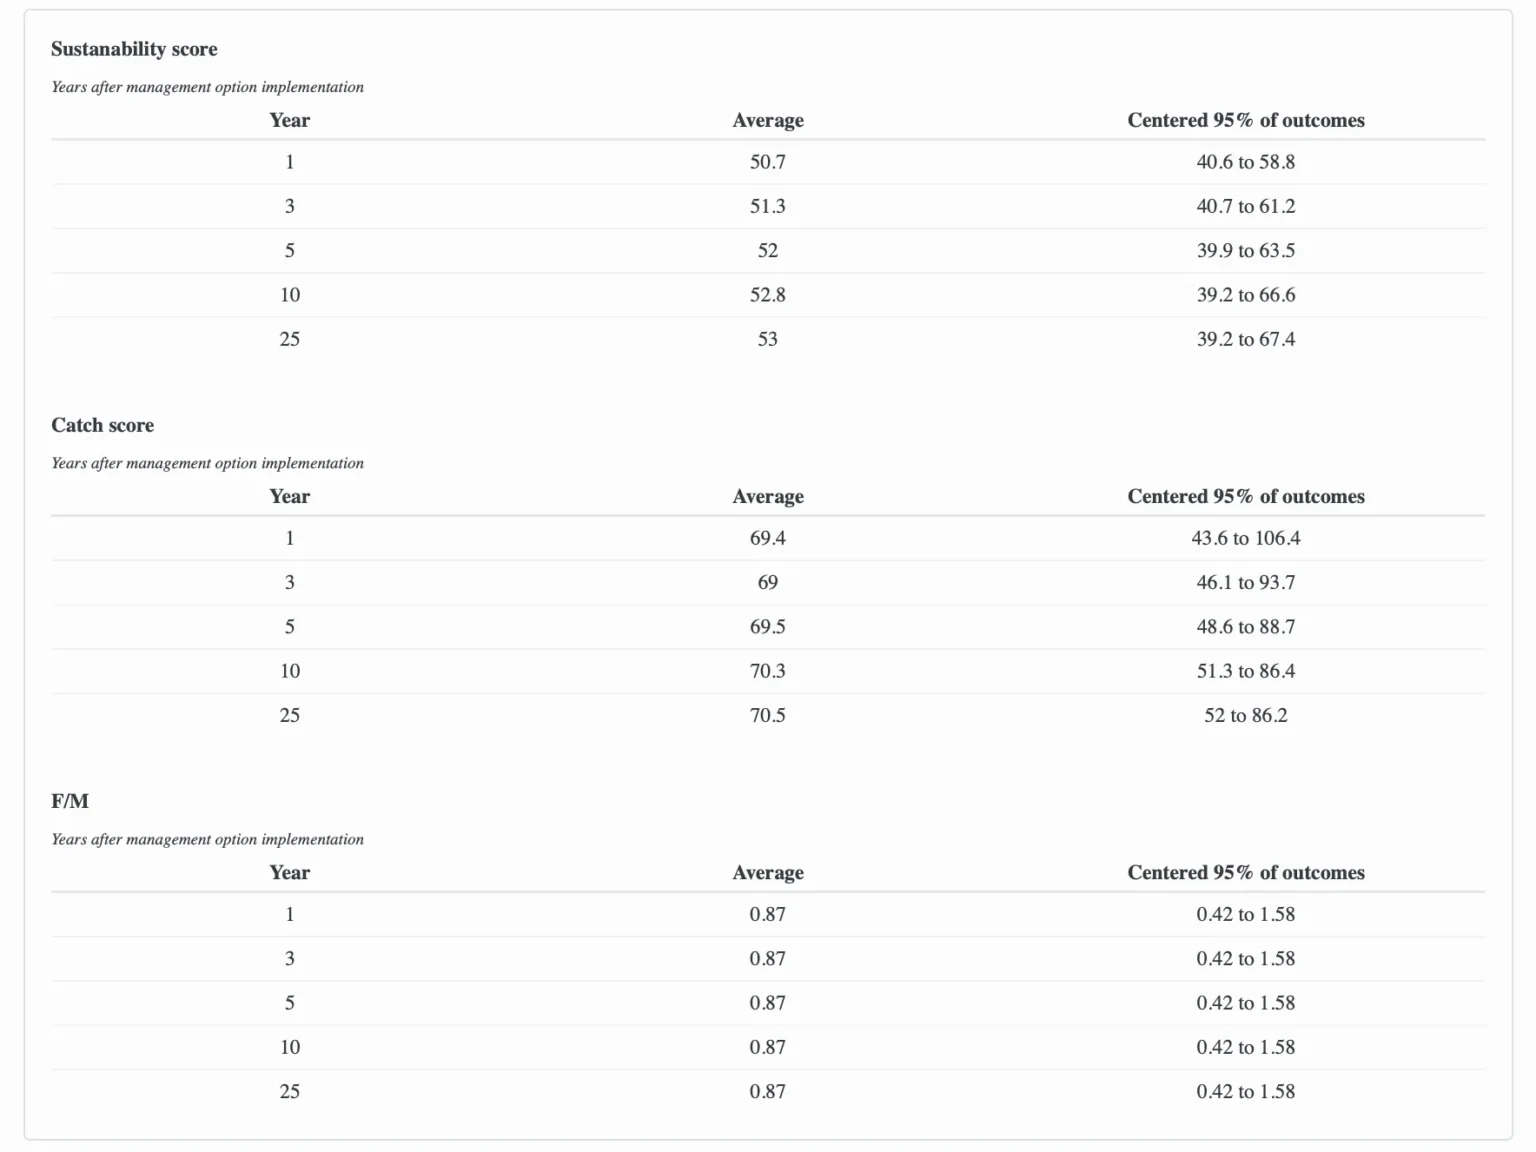
Below the dials, you will see tables with the same information as the dials for the catch and sustainability scores under the current fishery and with the management option. The table also includes a range for fishing rate (F/M) in both the current fishery and with the management option. While current fishery F/M is not a required input, the expected distribution of F/M that would have been necessary for the current equilibrium conditions is calculated as a derived quantity.
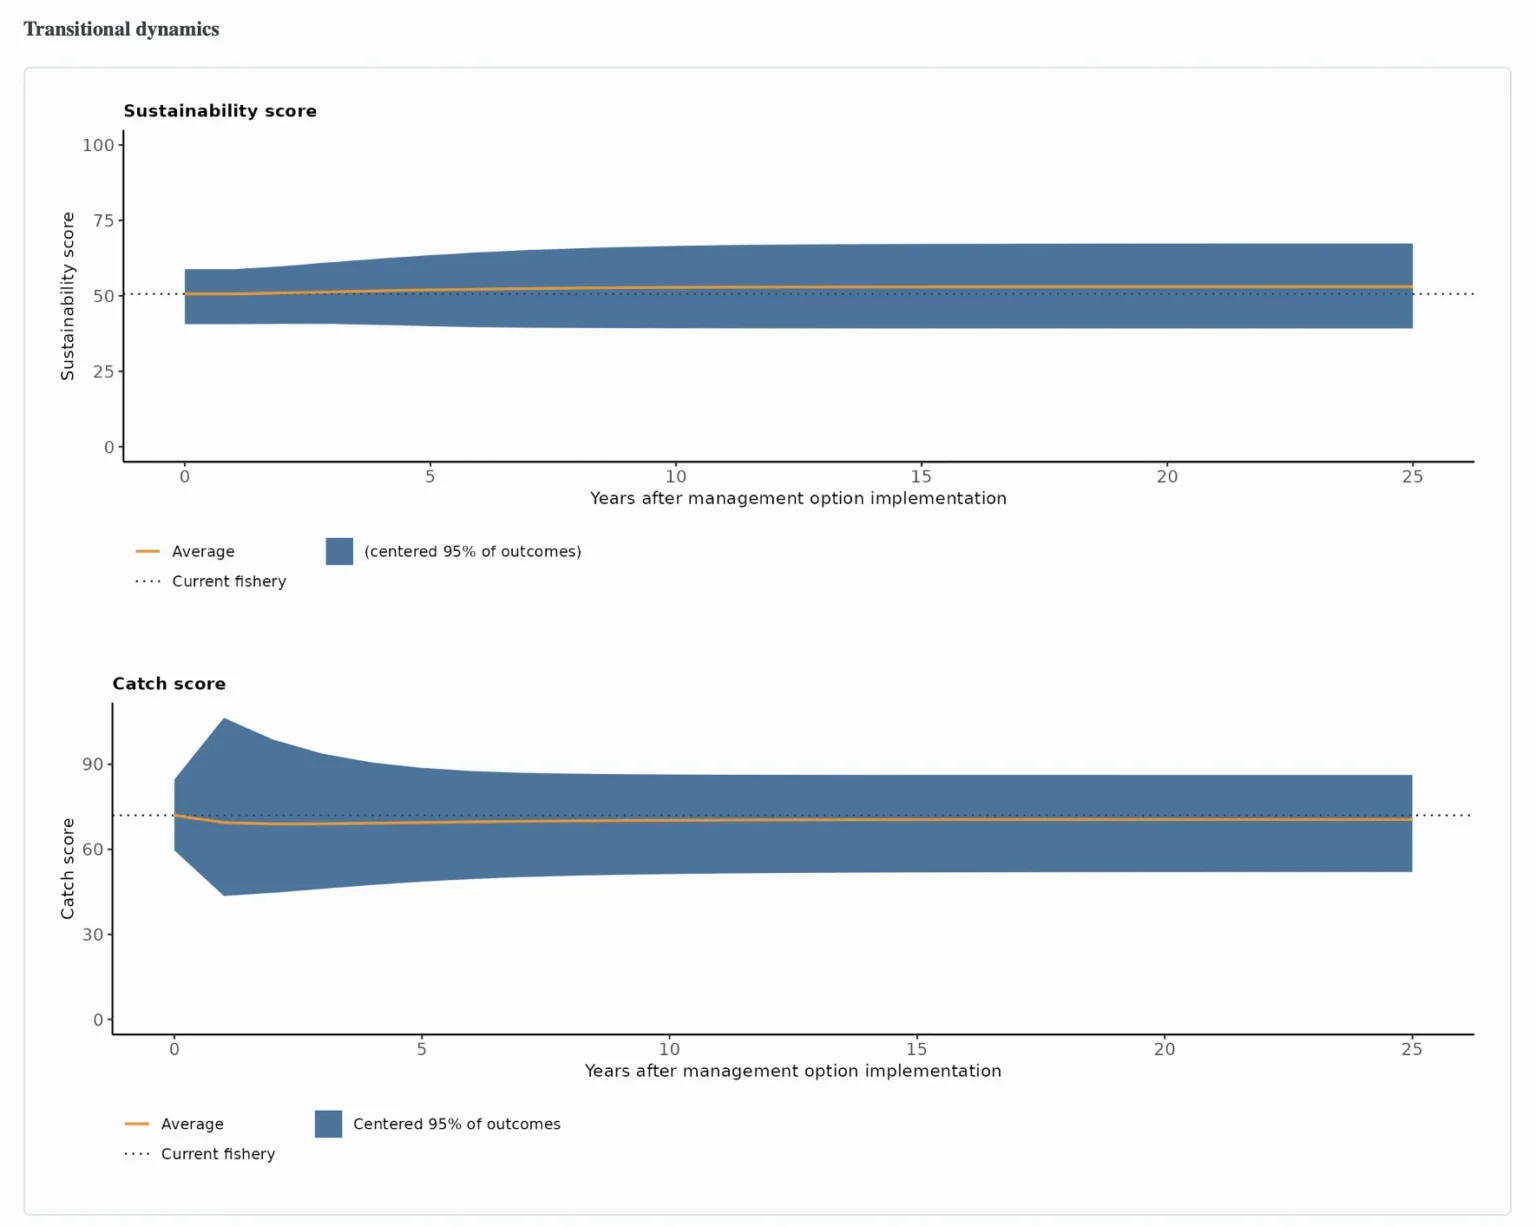
Below the tables is the “Transitional dynamics” section, which contains two graphs visualizing the sustainability and catch scores over time after management option implementation. Years after management option implementation is on the x-axis, and the sustainability or catch score is on the y-axis. For both graphs, the dashed horizontal line represents the current fishery average sustainability or catch score. The orange line represents the estimated average sustainability or catch score from year 0 to year 25 after management option implementation. The dark blue areas represent the most likely outcomes for sustainability or catch score each year (the centered 95% of outcomes).
For more detailed information, the tables below the graphs contain the numbers for sustainability and catch that are represented in the graphs. The top table is the sustainability score, and the second table is the catch score. For both tables, the first column is the years since management measure implementation, the second column is the average score (the orange line in the graphs), and the third column is the most likely outcomes for the score (the centered 95% of outcomes represented in dark blue on the graphs). Below these two tables is a table showing how fishing rate (F/M) changes after management option implementation.
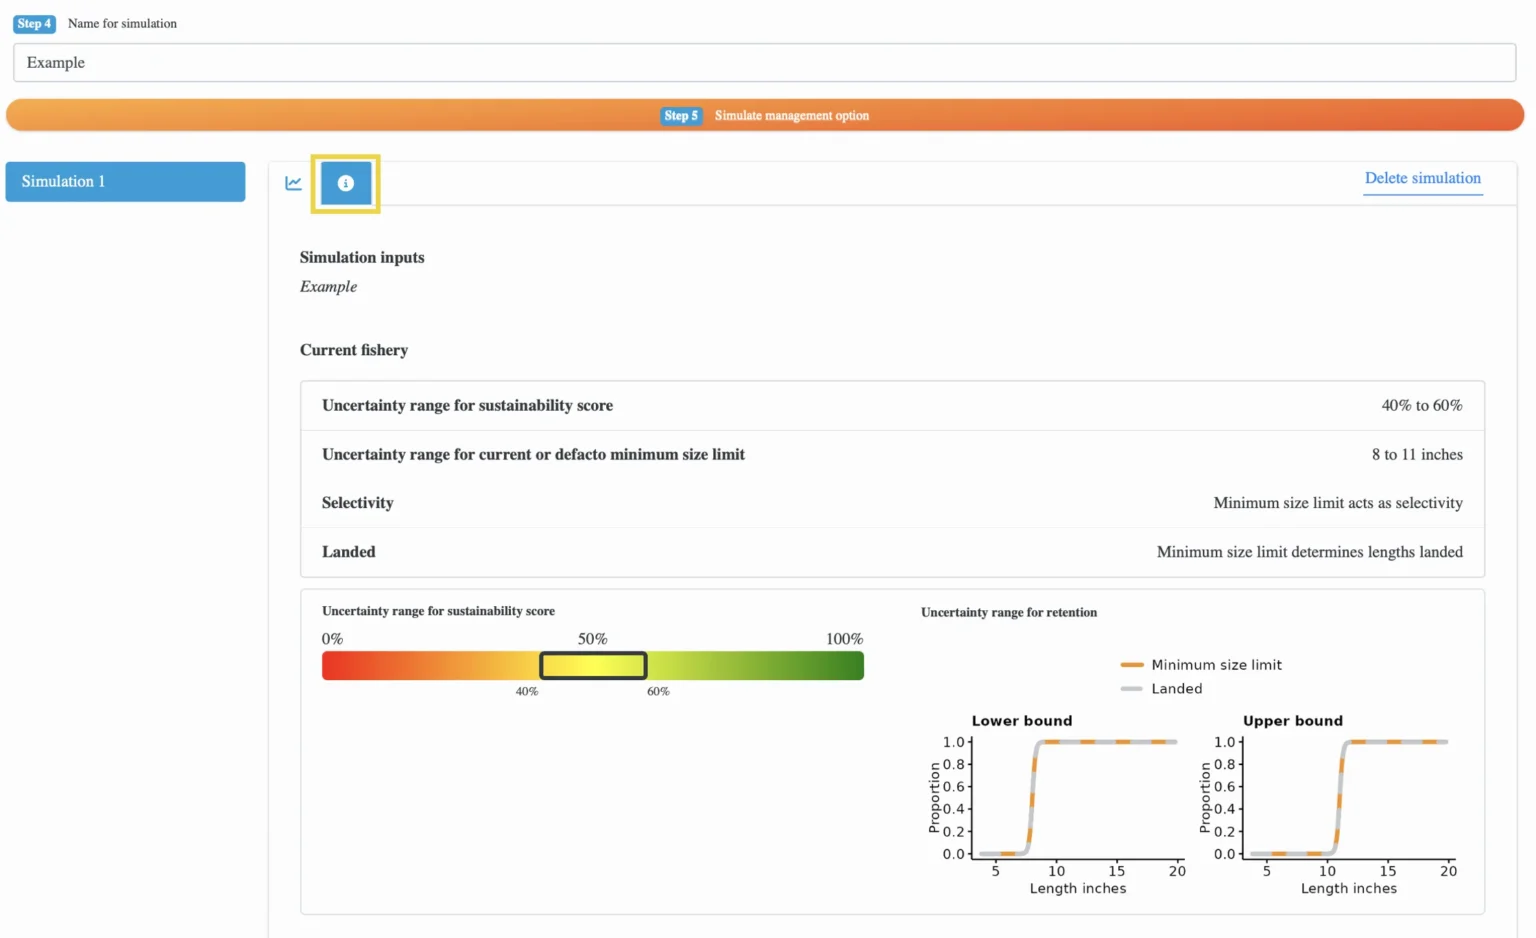
If you ever want to check what inputs you entered for the simulation, scroll back to the top of the simulation outputs section (below the orange “Step 5 Simulate management option” button). Below that button, you’ll see the tab with a graph icon highlighted in blue, indicating you are looking at the outputs of the simulation. Instead, click on the blue information “i” tab next to it. This will take you to a page that contains all the inputs you selected, including the current fishery, life history, and management option sections.
Relevant Modules:
1-2.g. Run multiple simulations (optional)
If you would like to explore how different size limits, proportional changes in fishing rate, or altered life history information affects the sustainability and catch of your fishery over time, you can run multiple transitional dynamics simulations. Go back to “Step 1 Current fishery” and follow steps B-E in this guide again to update the simulation.
Once it’s time to name the simulation, give it a different name. Once you’ve clicked “Step 5 Simulate management option,” your different simulations will appear below the button. You can toggle between them using the menu on the left. The information “i” tab for each simulation will contain the specific inputs you selected for that simulation, so you can always double check your inputs.
Relevant Modules:
3. Create report
Once you’re satisfied with your session or ready to close out of the app, scroll back up to the top of the dashboard and select “Step 3: Create report” to export a PDF detailing your session. The transitional dynamics simulations you created will automatically be included in the report.
Make sure your desired activation(s) are selected, and add a report title and author(s) if you’d like. If you’re willing to share your report with the FishKit team, so we can get a better idea of how the FishKit app is being used and better serve FishKit users like you, check “Yes” under “I agree to share the results of my FishKit session with the FishKit team.”
Note that any sharing will be of aggregated data that will be disassociated from the user and fishery of origin. Please review the FishKit Terms of Use for more information.
Then, select what you’re using the tool for from the dropdown menu. Lastly, click the orange “Create report” button, which will download the report to your computer.
Relevant Modules:

