Quick Start Guide: Stock Health Tracker

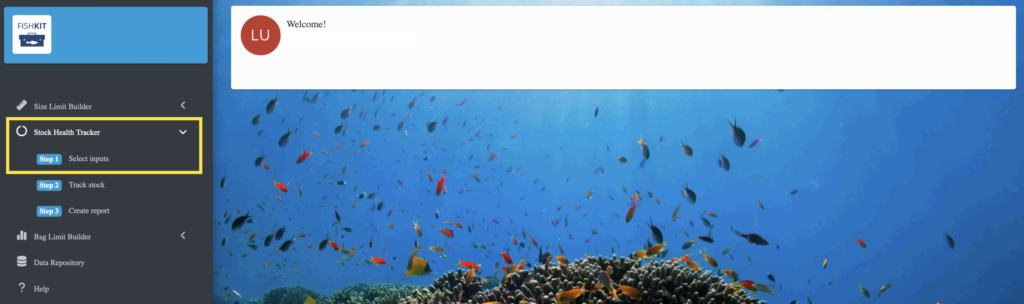
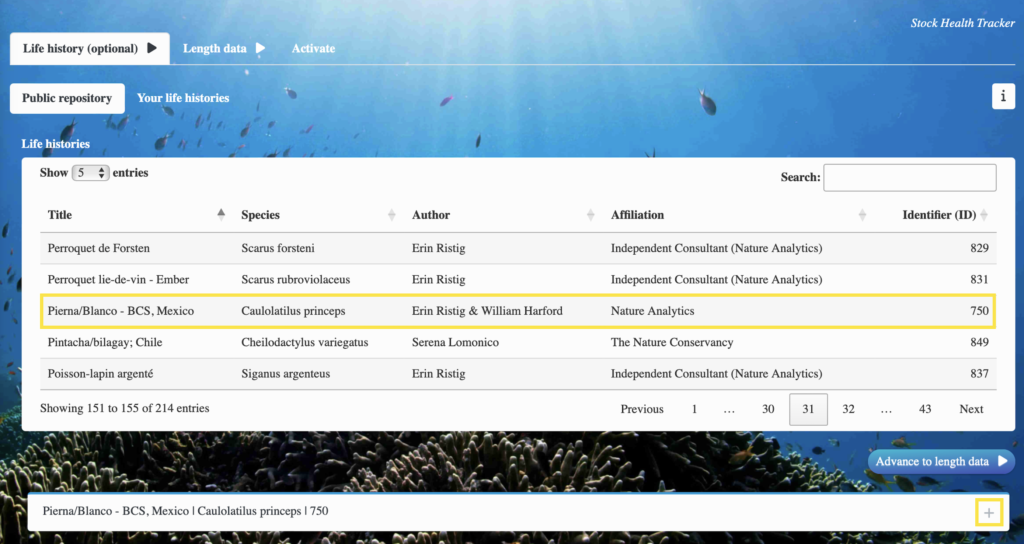
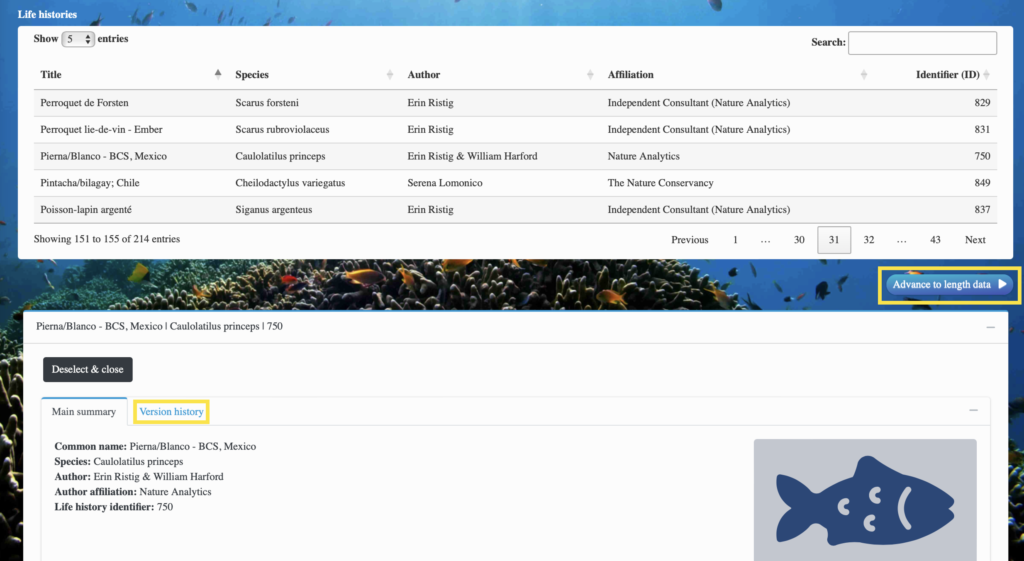
Here we’ll walk through the basic steps to get started evaluating length data with the Stock Health Tracker. The Stock Health Tracker leans on the power of length data to provide simple metrics, proven to be indicative of fishery health. Here users can upload and explore data, using interactive visualizations and automated reporting. Let’s get started!

1. Create an account

First, you’ll need to either log in or create an account with https://natureanalytics.ca/FishKit/.

2. Select inputs

Once you’re into the app, on the left hand side navigate to the “Input” section and select “Length data”.

3. Upload length data

In the length section – select “Upload Length Data” along the top. You should then step by step prompts helping you to correctly upload your data. Note here that there may be some work necessary to prepare your data for use in the app.

The first step is to attach your file (note that it must be in .csv format). Once your data is uploaded a preview of the data will appear to the right on the screen. Here you can check over and make sure your data was submitted correctly. Back on the left, you’ll want to ensure that you correctly indicate if the lengths are in raw length or frequencies, and if the data includes a header row. 

Lastly you’ll also want to answer three questions regarding how the lengths are measured. Once all of these prompts are correctly answered, you can return to the box on the right to enter a title and description for your data set. Now you’re set to “Finalize & save your length data”. 

4. Activate length data

Now that you’ve uploaded your data, at the top of the screen you can return to “your length data” and select your data set. Click preview and a box will appear below. Here you can review your data set and activate it for use in the app.

5. Select a life history

To use the stock health tracker, you will also need a life history. So still in the inputs section, select “Life History” on the left.

Here you can browse through all the available life histories available in the public repository. Once you find the life history you’d like to use, select it in the table, and then click the preview button below to view the life history.

 When you scroll down, you should then see a window containing a summary of the life history as well as the parameters themselves. Once you’ve decided that you would like to “Activate” the life history and make it available for analysis, click the “Activate” button. After doing so, you should see a blue checkmark appear indicating that the life history is now ready for use.

6. Set up Stock Health Tracker

Now that our inputs are ready to go, we can go to the analysis section on the left and select “Stock health tracker”. If they aren’t automatically selected, select the correct life history and corresponding length data set below for the species you’d like to evaluate.

7. Available metrics

Now you should see two dials appear in the white box above. The first is “mature fish in the catch” illustrating the proportion of data entries above the length at 50% maturity. The second illustrates the proportion of optimal sized fish in the catch. You can learn more about the basis for these metrics by clicking the info button in the top right corner. 

Furthest to the right, the “Fish above size limit” is blank. In the blue box below you can specify a size limit to evaluate how many fish in the catch appear to currently be above the size limit. Near the top of this box there are also tabs. Where you can navigate to metrics by “Group” which in this case is year. Finally, if you scroll down there are other additional metrics to explore. 

7. Create a report

To save your progress, go to the top right hand corner and click the “Create Report: button

Then you can download a PDF report with visualizations of your length data.

That concludes the overview of the Stock Health Tracker’s basic functionality! Please visit our resources page for more helpful information and tutorials.