Temporary Closures
The Temporary Closures module is designed to enable exploration of fishery closure for specific periods of time as management measures to reduce total catch, often in recreational, small-scale, and artisanal fisheries. The approach taken enables temporal data of catch per fishing event to be used as a baseline for considering the effects of closures on fishery yield. Catch per event data can provide a frame of reference against which the short-term effects of fishery closures can be evaluated.
Learn to use the Temporary Closure’s functions and interpret the results.
At a minimum, you need:
- Catch data per event for a single species, including dates for each trip
Additional optional data include:
- Catch data per event for additional species
- FishKit for evaluating tactical management options to learn when the Temporary Closures can be used in practice
- Temporary Closures: concepts and considerations
Steps for use
This section walks through the steps for creating temporary closure options with the Temporary Closure module.
1. Select inputs
If you have not already uploaded the catch data you want to use in Temporary Closures, upload catch data to the Data Repository, and then continue with the steps listed here.
1.a. Access Temporary Closures
Once you have uploaded catch data (in the correct format), or if you have previously uploaded the catch data you want to use, click the “Temporary Closures” on the left hand menu of the FishKit app. Then, click on “Step 1 Select inputs.” This will walk you through the information you need to select to use Temporary Closures.
Relevant Modules:
1.b. Select catch data
Click “Advance to catch data.” Select the catch data set you would like to use from the dropdown menu. Then, click “Select” to activate it. You can click the “+” next to the name of your data set to see more information about it, including a “Summary” tab with descriptive information, and a “Data” tab with a preview of the data.
If you would like to remove a data set once you have selected it, click on the “Deselect & close” button under the data set’s heading. Go back to the dropdown menu to select a new data set. You can also select multiple data sets.
When you’re ready to move on, click the “Advance to activate” button above the data set information.
Relevant Modules:
1.c. Activate the catch data
Once you have selected your desired catch data set(s), you’ll see the “Activate” screen.
Activation instructs FishKit to build an information packet that contains the required catch data set. Activation can be repeated for multiple catch data sets, and each will be available for analysis and report creation.
Make sure the catch data you want to use is selected in the “Catch data” dropdown menu. You can then rename the activation if you would like. Then, click “Activate.”
Once you’ve activated the catch data, you’ll get this alert. Click anywhere on your screen to dismiss it.
Note that if you selected multiple catch data sets in the previous step, you can repeat this step multiple times to activate multiple data sets.
Relevant Modules:
2. Explore closures
Relevant Modules:
2.b. Explore the Temporary Closures dashboard
You have now entered the Temporary Closures dashboard. The name of your activation will be listed along the top of the page.
The first screen you see includes a bar chart at the top and a set of radio buttons specifying the types of closures available to explore. The radio buttons display options for a variety of temporal periods, such as lunar cycle or month of the year. When a type of closure is selected, the bar chart will re-organize your catch data, according to dates, into the corresponding levels of the selected temporal period.
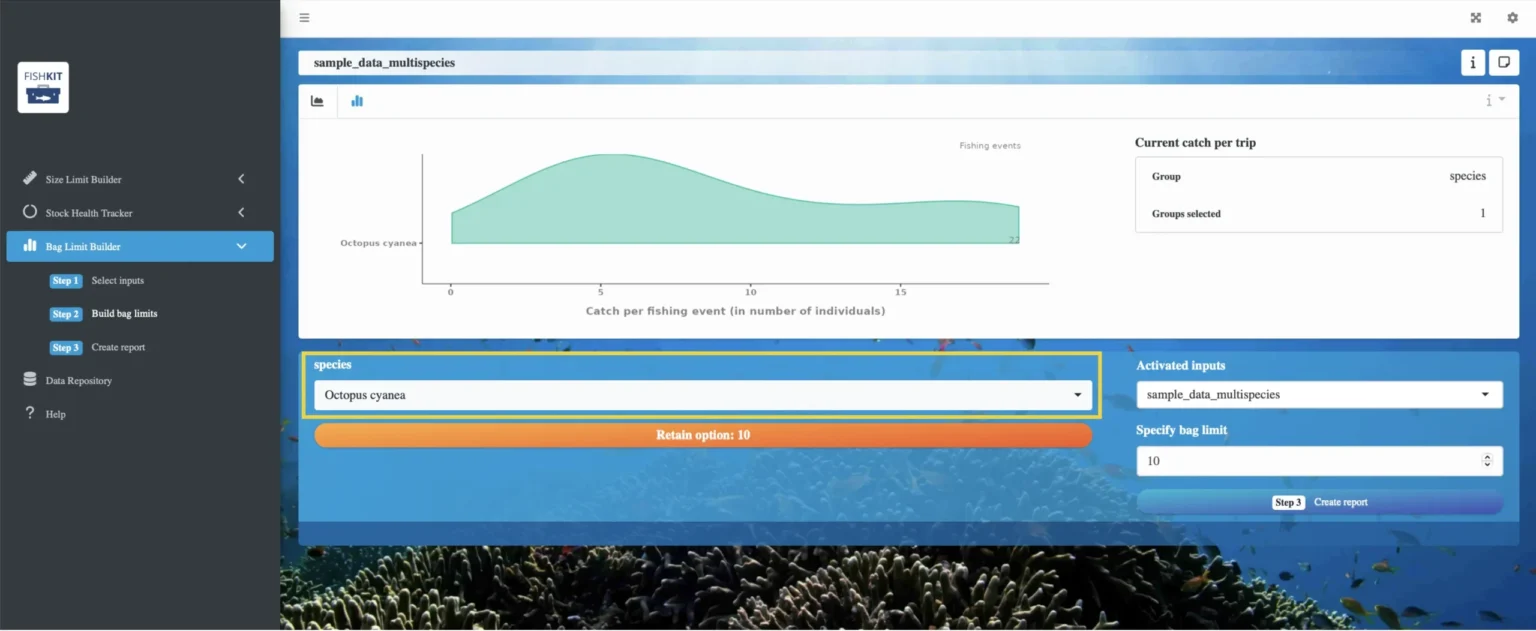
If your catch data set only has data for one species (or group), the dropdown menu on the right will only list that species. However, if your catch data set contains multiple species, use the dropdown menu to select one or more species of interest. Clicking on a species name will select that species and modify the bar chart at the top of the page. Note the Bag Limit Builder can only be used for single-species bag limits at this time.
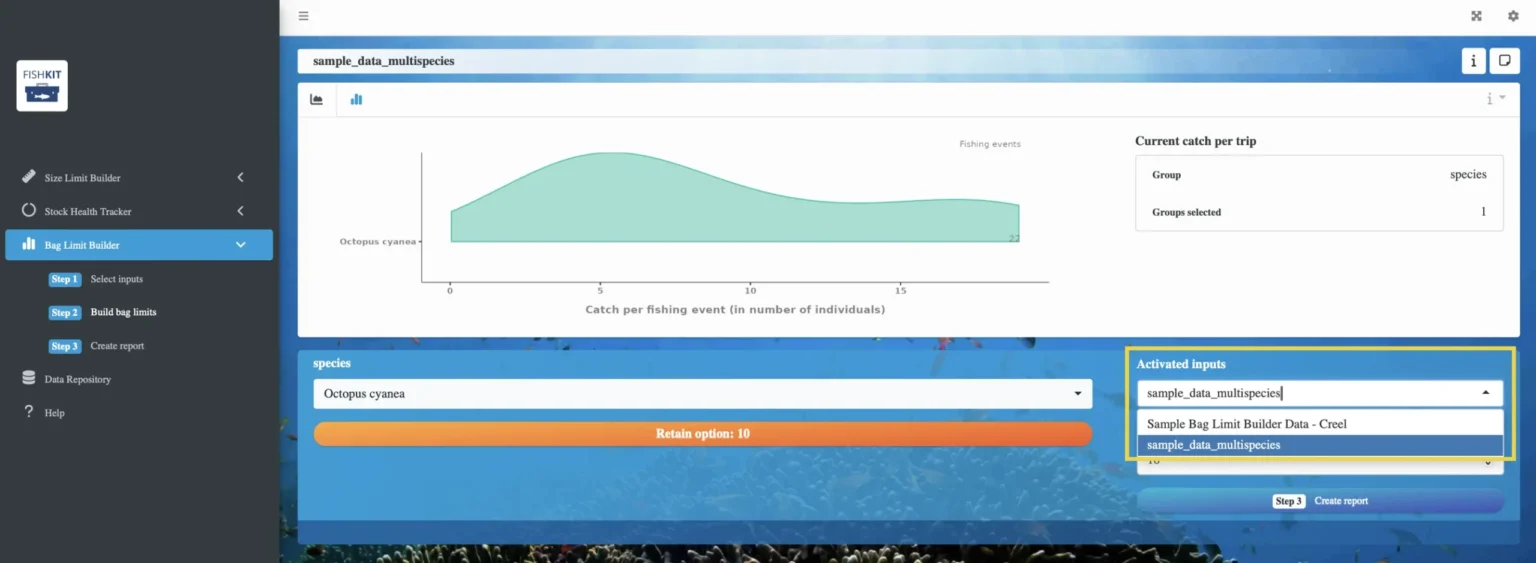
If you activated multiple catch data sets, you can toggle between them using the dropdown menu under “Activated inputs.” Changing the activated input will automatically update the rest of the information on the Temporary Closures dashboard.
Relevant Modules:
2.c. Retain options
To explore the effects of temporary closures on catch, select a type of closure, then select the corresponding levels you wish to close, such as one or more lunar periods or months of the year. Doing so will modify the bar chart to reflect your selections and will calculate how your proposed closure will affect the catch.
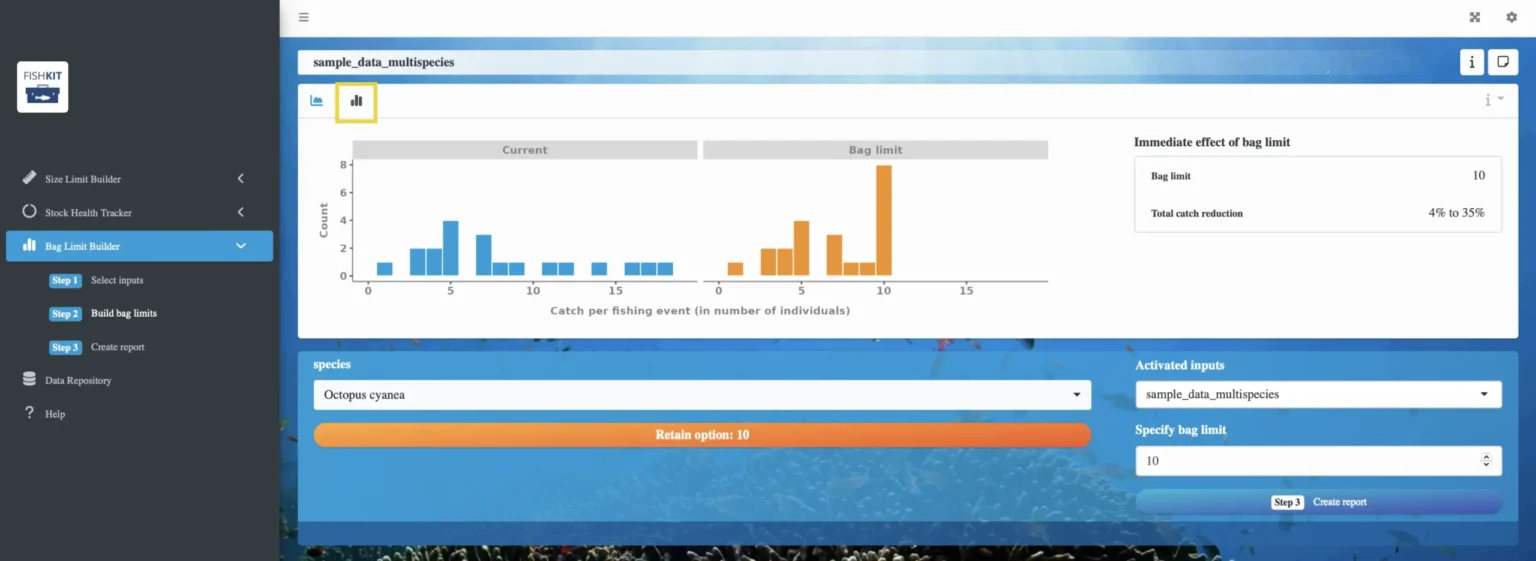
To the right of the bar chart, you can see the estimated catch reduction. The estimated catch reduction is a percentage of the current catch that is expected to occur in the short term following implementation of the specified closure. Additionally, click the calendar bar chart icon in the upper left corner. The calendar will highlight the dates associated with your proposed closure during the next three calendar years.
The Temporary Closures module can be used to analyze single-species closures (single level of grouping variable selected) or aggregate closures (multiple levels of grouping variable selected). Importantly, Temporary Closures uses trip identifier, column one in the loaded data set, as a unique identifier of each fishing trip. Summation by unique identifier occurs prior to analysis and presentation of results to users. Thus, non-unique (repeat) identifiers are presented as the summation of catches reported in column two. This summation feature enables the use of a grouping variable to examine single-species closures or aggregate closures. When multiple group levels are selected, these should correspond to shared trip identifiers, thus, summation by trip will result in aggregate total catch per trip for the selected set of species (or group levels). For example, suppose we had two records as follows:
Record 1: id = 1, catch = 7, group = species1
Record 2: id = 1, catch = 5, group = species2
When both group levels (species1 and species2) are selected, trip identifier 1 will result in a single record reflecting a catch of 12. Analysis of estimated catch reduction follows this aggregation step.
Once you’ve landed on a temporary closure that you’d like to retain for that species, click on the orange “Retain option” button to save that option. Once you’ve retained an option, you can scroll down to see it displayed below.
You can then add a ranking and notes about the temporary closure in the “Retained options” tab below the graphs.
You can repeat this process for as many closure options as you like, and the FishKit app will retain your progress by saving the closure options in the “Retained options” tab.
Note that if you have a single data set with multiple species, you can toggle between different species from the same activation to save species-specific options. All of the retained closure options will appear in the same list, but the species will be specified for each option.
Relevant Modules:
3. Create report
Once you’re satisfied with your session or ready to close out of the app, select “Step 3: Create report” to export a PDF detailing your session.
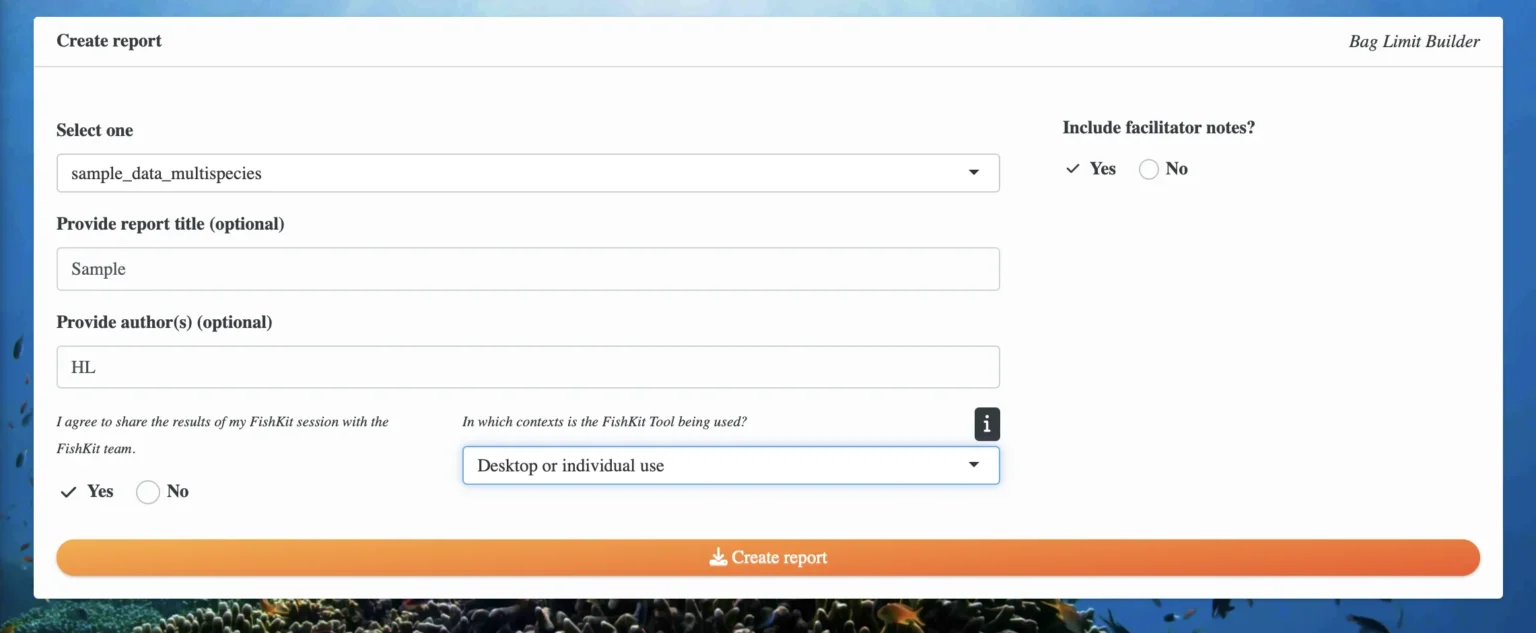
Make sure your desired activation is selected under the “select one” dropdown menu, and add a report title and author(s) if you’d like. If you’re willing to share your report with the FishKit team, so we can get a better idea of how the FishKit app is being used and better serve FishKit users like you, check “Yes” under “I agree to share the results of my FishKit session with the FishKit team.”
Note that any sharing will be of aggregated data that will be disassociated from the user and fishery of origin. Please review the FishKit Terms of Use for more information.
Then, select what you’re using the tool for from the dropdown menu. Lastly, click the orange “Create report” button, which will download the report to your computer.
If you retained closure options for multiple activations, after you create the first report, you can go back to the “select one” dropdown menu to select a different activation and save a separate report for it.
You can continue to explore the Temporary Closures with as many catch data sets and reports as you’d like!
Relevant Modules:
Interpreting results
The Temporary Closures module allows you to see the short-term effects of a temporal closure on total fishery catch via the estimated catch reduction metric. The estimated catch reduction metric represents an estimated range of percentage reductions from current catch levels in the short term following the implementation of a specified closure option. This information helps to elucidate the tradeoffs and costs associated with implementing a fishery closure in the short term.
At this time, the Temporary Closures module does not provide insight into the long-term outcomes of repeated seasonal closures.
- See the Temporary Closures: concepts and considerations section for more details


