The Stock Health Tracker lets users quickly assess fishery health using length data. Learn to use the Stock Health Tracker’s functions and interpret the results.
This section walks through the steps for evaluating length data with the Stock Health Tracker to gain insight into fishery health. The steps in this section correspond with the steps in the left hand menu of the FishKit app.
1. Select inputs
If you have not already uploaded the length data you want to use in the Stock Health Tracker, upload length data to the Data Repository, and then continue with the steps listed here.
1.a. Access the Stock Health Tracker
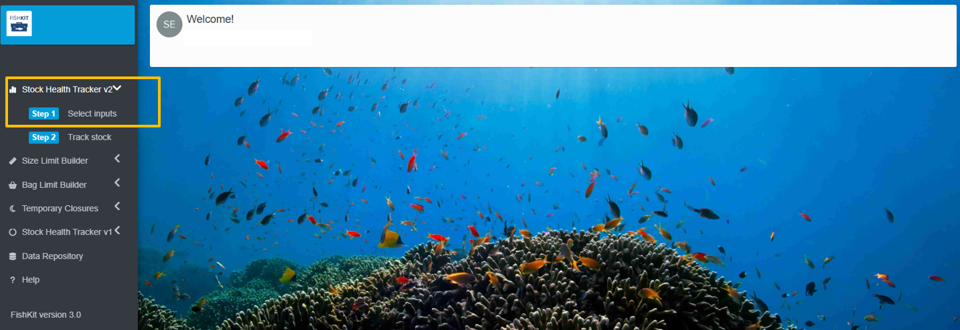
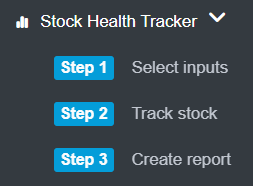
Once you have uploaded length data, or if you have previously uploaded the length data you want to use, click “Stock Health Tracker” on the left hand menu. Then, click “Step 1 Select inputs.” This will walk you through all the information you need to select to use the Stock Health Tracker.
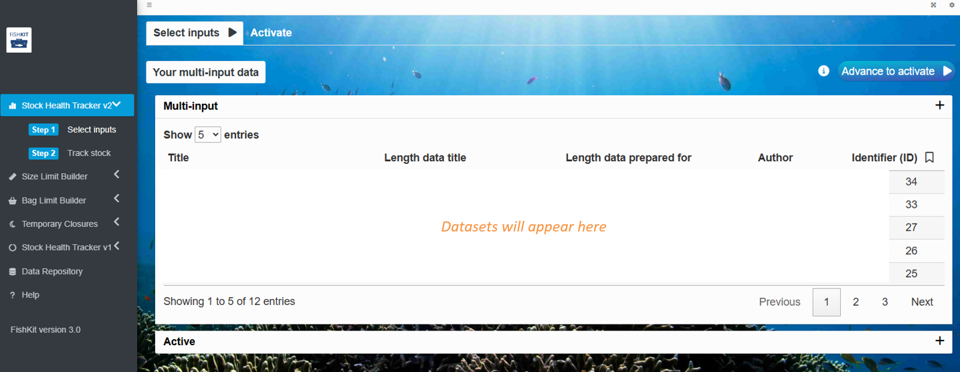
Length data sets you have previously uploaded to the Data Repository will appear in the dropdown menu under “Length data sets.” Click on the menu to preview your data sets, click on the one you would like to use, and then click the “Select” button below the dropdown menu.
As a reminder, this length data is not automatically shared with anyone. To allow anyone access to your length data, you have to send them an invitation in the Data Repository, otherwise it remains private to only you.
You can then click the “+” next to the name of your data set to see more information about the data set, including a “Summary” tab with descriptive information, and a “Data set” tab with a preview of the data.
If you would like to utilize multiple length data sets, you can continue to click on them in the dropdown menu and select them. Once you have selected all the desired length data sets, click the “Advance to selectivity” button in the upper right corner.
When you’re ready to move on, click the “Advance to activate” button above the data set information.
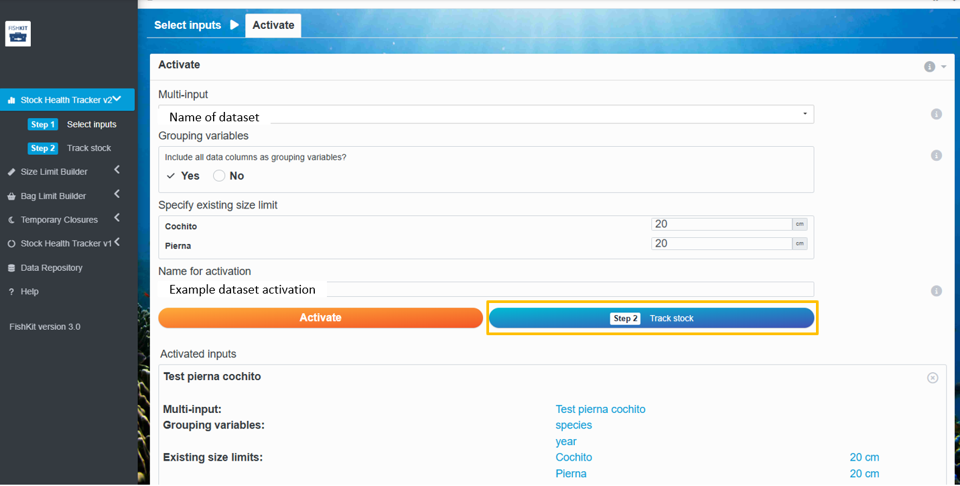
Once you have selected all your desired inputs, you’ll see the “Activate” screen.
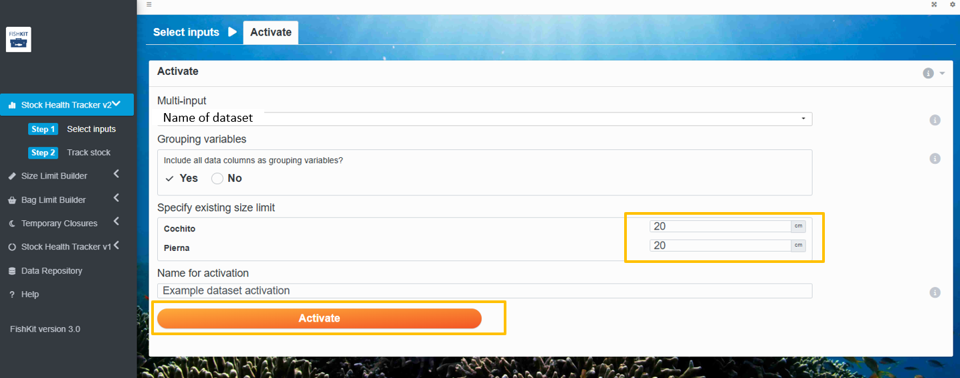
Activation instructs FishKit to build an information packet that contains a required length data set. Activation can be repeated for multiple length data sets, and each will be available in the analysis and report creation.
The user may also add a size limit, if one exists.
Then, if you’d like, you can adjust the name for the activation.
Then, click “Activate.”
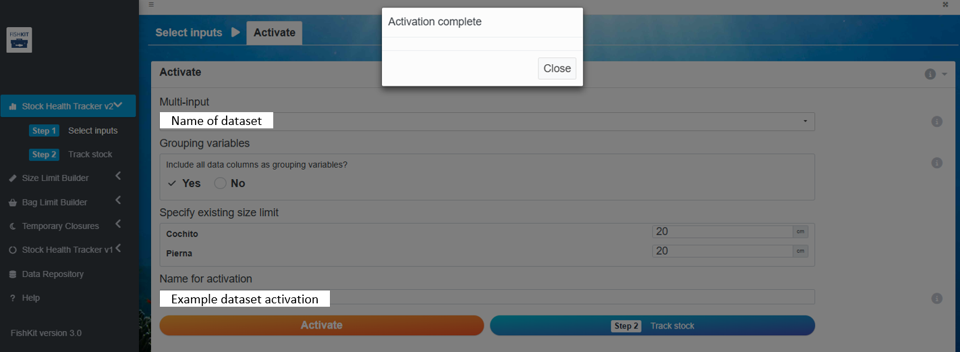
After the activation processes, you will get an alert saying “Activation complete.” Click Close to dismiss the alert.
Relevant Modules:
2. Track stock
If you have not already uploaded the length data you want to use in the Stock Health Tracker, upload length data to the Data Repository, and then continue with the steps listed here.
2.a. Track stock
Once you’ve finished activating your desired combination(s), click “Step 2 Track stock.”
Relevant Modules:
2.b. Explore the Stock Health Tracker dashboard
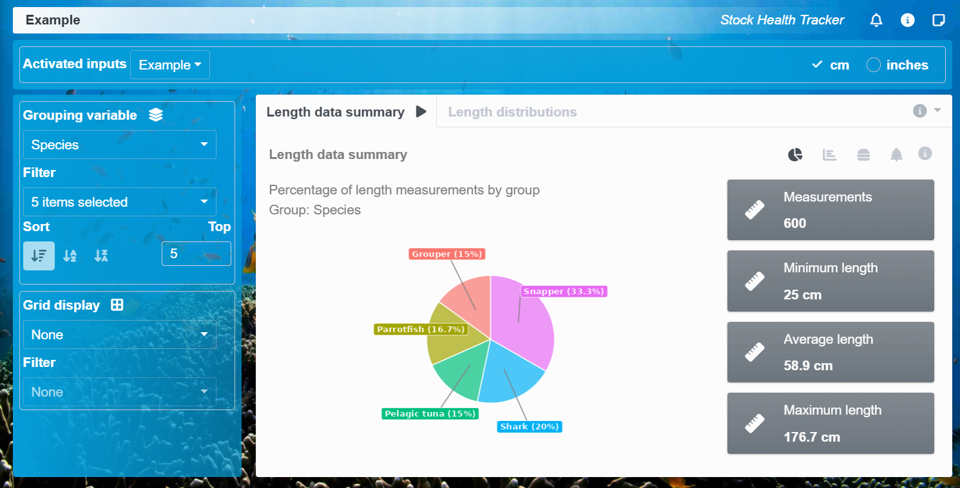
Now you have entered the Stock Health Tracker dashboard. The name you gave your activation should be listed along the top of the page.
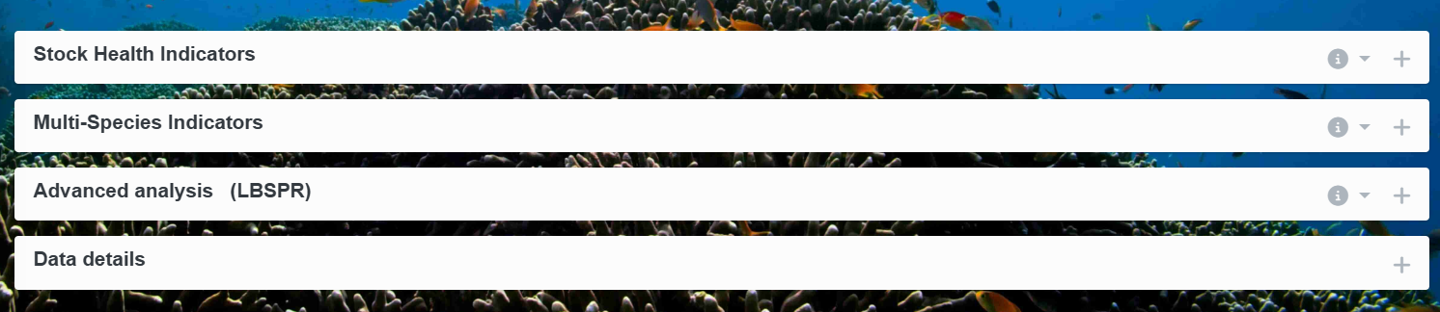
This dashboard has simple metrics or indicators for learning about stock health, based on your length data and life history data. There are five main subsections: 1) length data visualizations; 2) Stock health indicators; 3) Multi-species indicators; 4) Advanced Analysis – Length-based spawning potential ratio (LBSPR); 5) Data details. Each section can be expanded by clicking the “+” plus sign on the right hand side.
The first section, displayed as the user enters the dashboard, includes tabs for Length data summary, and Length distributions. The user can choose different plot styles to visualize the data in different ways by selecting the grey plot icons near the right corner.
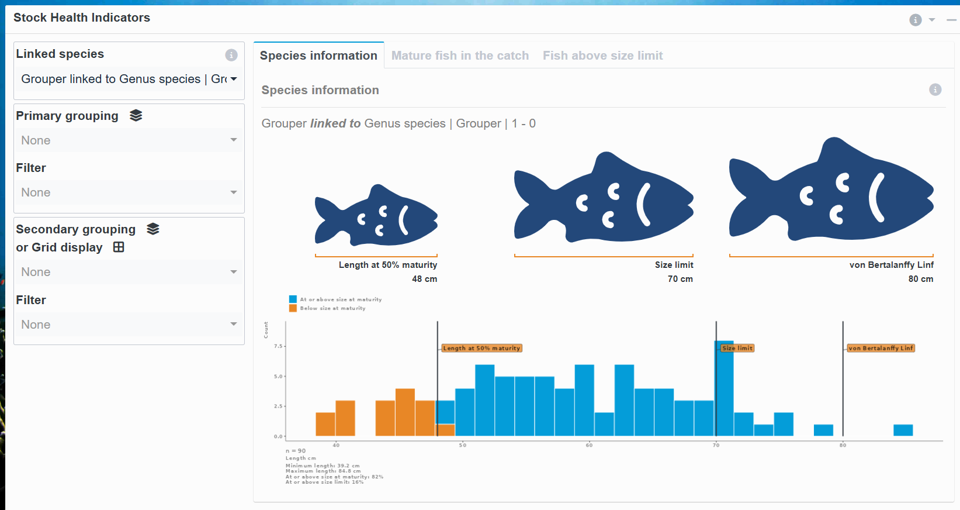
The second section contains Stock Health Indicators: Species information, mature fish in the catch, and fish above size limit. The linked species’ life history is displayed on the left hand panel. The graphs are called length frequency bar graphs, with the lengths of individual fish on the bottom (x-axis) and the count or number of each individual at that length on the y-axis.
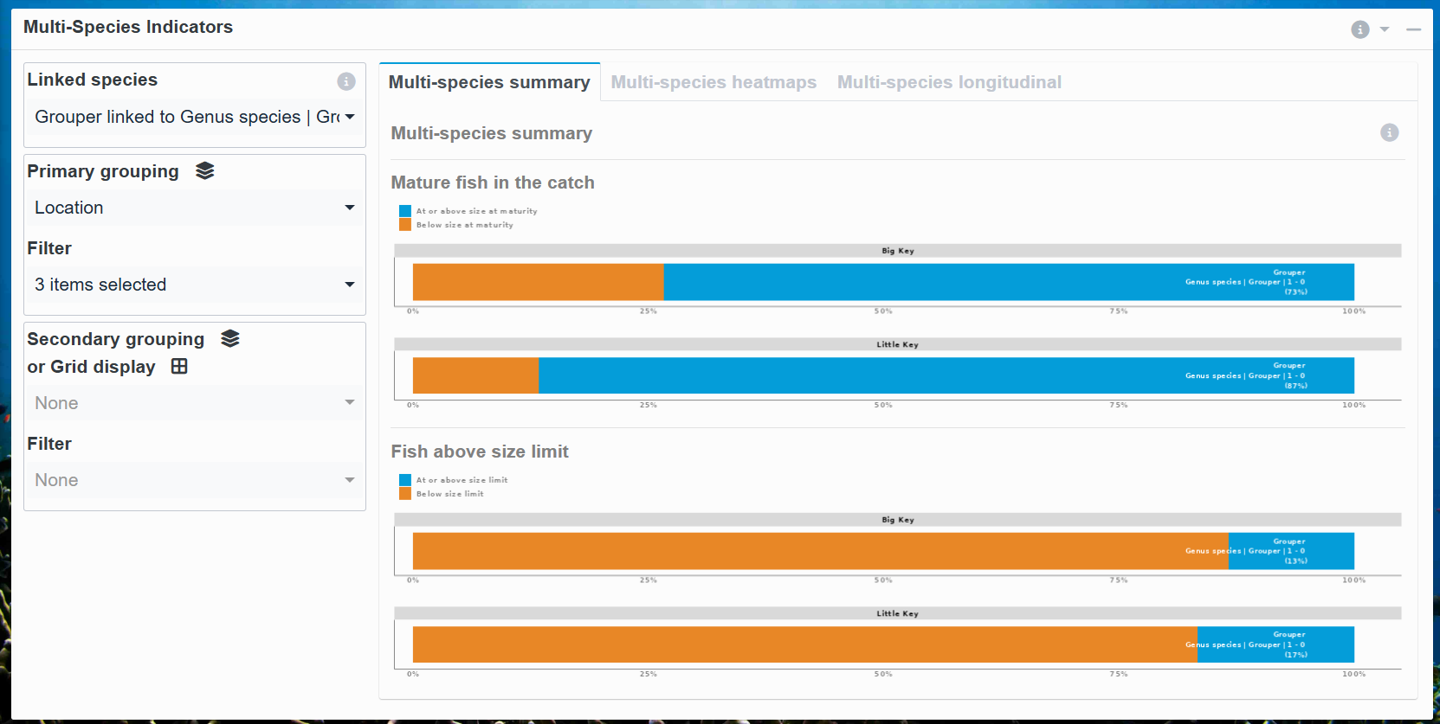
The third section is multi-species indicators: multi-species summary, multi-species heatmaps; multi-species longitudinal (time series).
The fourth section is Advanced Analysis – Length-based spawning potential ratio (LBSPR). As this is an advanced analysis, additional detail is provided further below after “3. Create Report”.
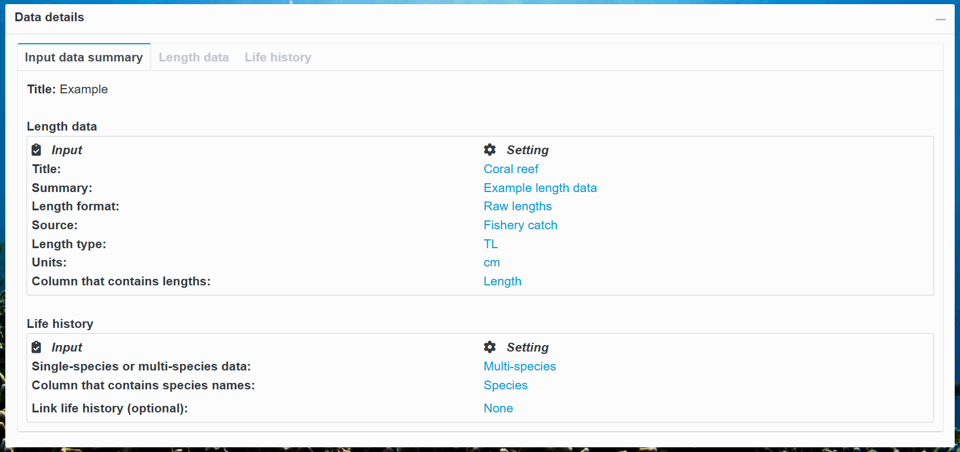
The fifth section is Data Details. Here, you can see tabs for Input data summary, Length Data, and Life history that were used in the Stock Health Tracker analyses.
Once you’re satisfied with your session or ready to close out of the app, select “Step 3: Create report” to export a PDF detailing your session.
Here, you will see two types of reports, a detailed report and a mobile report. The detailed report is automatically selected, but if you would prefer a mobile report, select “Mobile report” at the top of the box.
Detailed report: The detailed report provides a longer, technical summary report in a PDF format. It includes detailed information about the length data set, as well as information about the life history if you included one in your activation. It then provides detailed information about all of the metrics.
Mobile report: The mobile report provides a short, non-technical summary in a PDF format that could be easily read on a phone screen. It provides a simplified report with graphics tailored for community member audiences.
Once you have decided between a “Detailed report” and a “Mobile report,” select the activated information packet that you would like to turn into a report.
Add a report title and author(s) if you’d like. If you’re willing to share your report with the FishKit team, so we can get a better idea of how the FishKit app is being used and better serve FishKit users like you, check “Yes” under “I agree to share the results of my FishKit session with the FishKit team.”
Note that any sharing will be of aggregated data that will be disassociated from the user and fishery of origin. Please review the FishKit Terms of Use for more information.
By sharing your results you can help us better understand how FishKit is being used in order to better serve FishKit users like you.
For the detailed report, you can also include facilitator notes that you may have taken.
For the mobile report, in the gray box on the left, use the dropdown menu to select the metrics (up to three) that you would like to include in the report.
Lastly, for both report types, click the orange “Create report” button, which will download the report PDF to your computer.
You can continue to explore the Stock Health Tracker with as many life histories, length data sets, and reports as you’d like!
Relevant Modules:
Interpreting results
The Stock Health Tracker uses length data and life history information to visualize common indicators of fishery health. Each indicator relates to a specific fishery management goal. Prior to utilizing an indicator, consider whether it is relevant to the fishery’s objectives.
Mature fish in the catch: The mature fish in the catch metric tells you what percentage of your catch is above the length at maturity. The goal of this metric is to help to ensure population replenishment. The target for the mature fish in the catch metric is 100%, as this allows fish to reproduce at least once before being susceptible to fishing. If this metric is not at 100%, exploring management measures, such as size limits set above the length at maturity, could help to improve this score.
Fish above the size limit: The fish above the size limit metric tells you what percentage of your catch is above a specified size limit. The goal of this metric is to ensure compliance with a given size limit. If your fishery has a formalized size limit, the target for this metric is 100%. If the percentage is close to 100%, it can indicate accidental take or occasional user error, but still suggests general compliance. If the percentage for this metric is drastically lower than 100%, it suggests examining the size limit and implementation strategy may be necessary.
Length-based spawning potential ratio (LBSPR) is a data-limited stock assessment method that is used to estimate spawning potential ratio (SPR) from length composition data from the catch of an exploited stock. LBSPR should be applied and interpreted with care as it is not appropriate for all species or fisheries contexts, or users of the Stock Health Tracker.
An LBSPR analysis can be carried out within FishKit’s Stock Health Tracker following these steps:
The LBSPR feature in FishKit is housed within the Stock Health Tracker. To use the LBSPR feature, start by completing steps 1-2 of the “Steps for use” section above.
a. Setup the LBSPR analysis
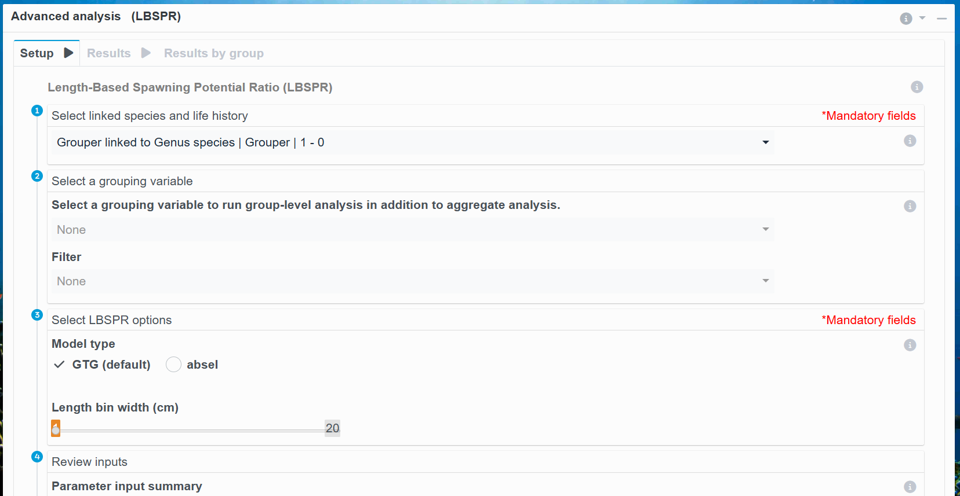
After completing steps 1-2 of the “Steps for use” section of the Stock Health Tracker, you should be at the Stock Health Tracker dashboard page. Scroll down to the white Advanced Analysis (LBSPR) section.
Here, there are 3 tabs: Setup, Results, Results by Group.
To run LBSPR, 1) select a focal species and life history. Then, 2) select a grouping variable. Then, 3) select the type of model you would like to use: “GTG (default),” or “absel.” The “GTG” model is the default option and is likely suitable for most users. Then, 4) review inputs.
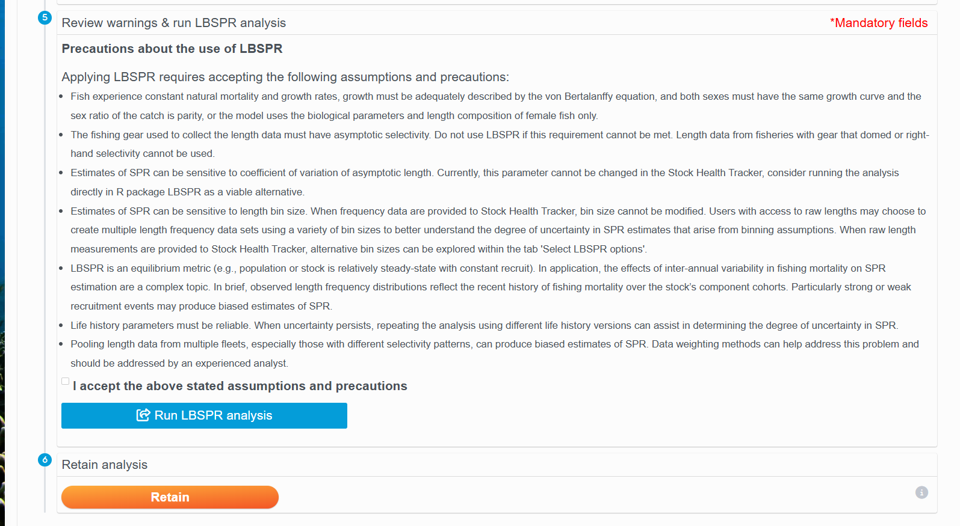
Finally, 5) Review warnings and run LBSPR analysis. After understanding the assumptions and precautions, click the blue button “Run LBSPR analysis.” Here, the user may also 6) Retain the analysis combination.
Relevant Modules:
b. Results
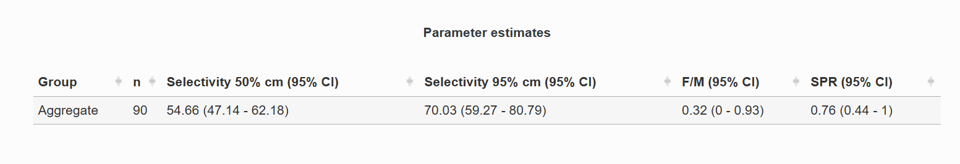
The Results tab has 4 main sections: 1) Parameter Estimates, 2) Fit to Aggregate Length Data; 3) Predicted Aggregate Length Distributions; 4) Selectivity Estimates for Aggregate Length data.
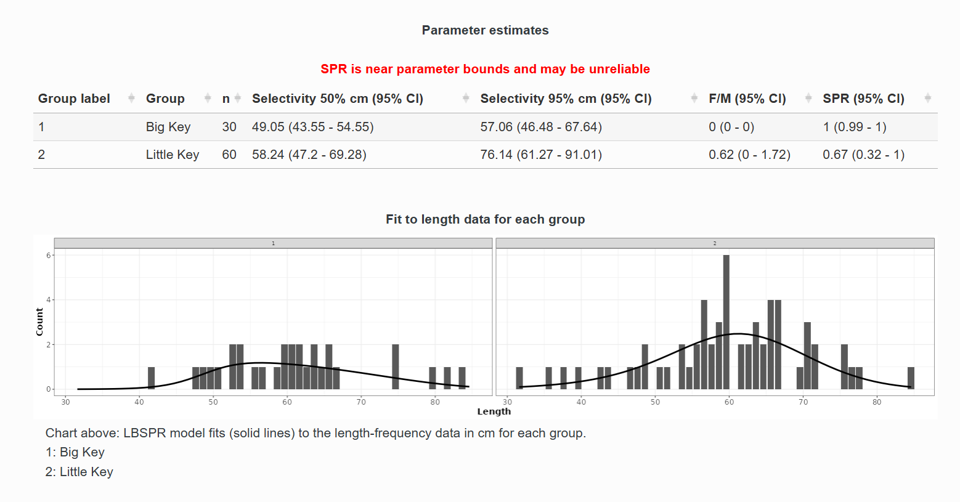
In the Parameter Estimates section, “Selectivity 50%” and “Selectivity 95%” are the estimated logistic selectivity parameters. These parameters reflect the length at which 50% of the population is vulnerable to the fishing gear, and the length at which 95% of the population is vulnerable to the fishing gear, respectively. The “F/M” column is the relative fishing mortality to natural mortality ratio. Spawning potential ratio (SPR) is also included. These estimates are provided for the overall data set, as well as for each group (year).
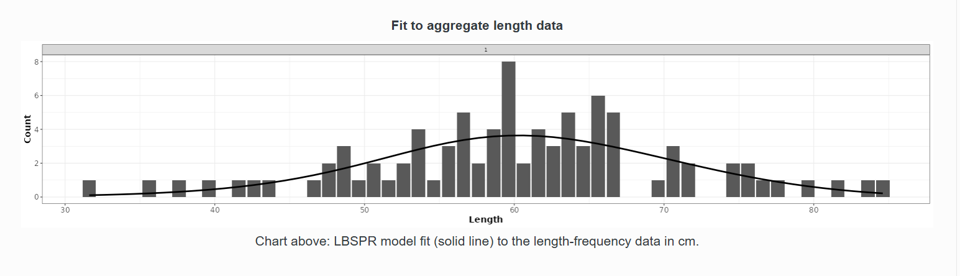
The second section is a graph of fit to aggregate length data. The graph shows the extent to which the LBSPR model predictions (solid line) align with the observed length-frequency data. A good model fit should capture the shape and distribution of fish lengths, ensuring that the predicted lengths correspond to the observed size structure in the data set.
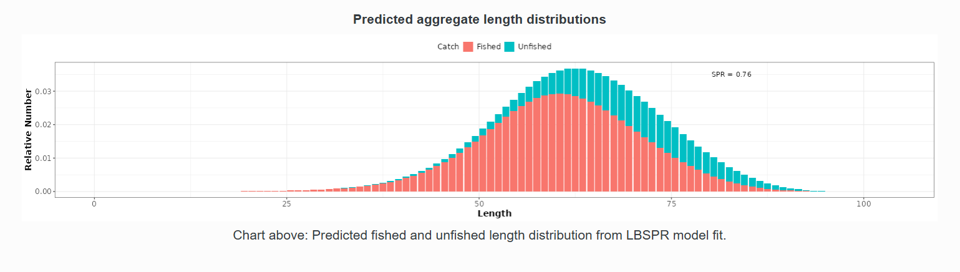
The next graph is predicted aggregate length distributions.
Below, you’ll find the graph of selectivity estimates for aggregate length data. This graph shows LBSPR model estimates of maturity-at-length (pink line) and selectivity at length (blue line). The maturity curve represents the proportion of fish in the population that are sexually mature at each length. The selectivity curve represents the proportion of fish retained by fishing gear at each length. If the ascending limb of the selectivity curve (blue line) is to the right of the maturity ascending (pink line) limb, as shown in this example, sexually mature fish are being targeted. This positioning helps to promote fishery sustainability by lowering the risk of catching immature individuals.
You’ll then find graphs of selectivity estimates for each group. Like the previous graph, this graph shows selectivity at length and maturity-at-length estimates, but with selectivity at length separated out by group (year). The bold, black line represents maturity at length for the whole data set, while the colored lines represent selectivity at length for different years. If a selectivity at length ascending limb is to the right of the maturity-at-length ascending limb, sexually mature fish were being targeted for that year. In this example, sexually mature fish were being targeted every year.
Relevant Modules:
c. Results by Group
The Results by Group tab allows you to view the same LBSPR Results as above, but faceted by a grouping variable of choice.
This functionality only works if in the “Setup” tab, you select a grouping variable, in this example, “Location”. This allows you to see LBSPR results by multiple locations at the same time.
Below, two of the sections are featured, grouped by “Big Key” and “Little Key” in this example.